1 · Principles of Laboratory Diagnostics
Instructional Objectives
Topic Outline 1: Principles of Laboratory Diagnostics
- Define the importance and role of laboratory testing in the evaluation of a patient.
- Discuss the importance of patient counseling for diagnostic testing to reduce medical errors.
- Describe the phases of the diagnostic testing process: pretest phase, intratest phase, posttest phase.
- Explain the components of the: pretest phase, intratest phase, posttest phase.
- Identify which colored laboratory collection tubes correspond to common laboratory tests.
- Define the purpose and appropriate use of: stool studies, throat cultures, sputum cultures, blood cultures.
- Define point-of-care (POC) testing.
- Discuss common point-of-care tests performed in primary care and acute care settings.
- Compare and contrast qualitative and quantitative diagnostic tests.
- Discuss the availability, advantages, and limitations of point-of-care testing.
- Describe quality assurance measures necessary for point-of-care testing.
- Discuss accreditation and regulatory considerations related to point-of-care testing.
- Define sensitivity, specificity, positive predictive value, and negative predictive value.
- Differentiate between screening tests and diagnostic tests.
- Explain the concepts of pretest probability and posttest probability.
Professor Reynolds answered “what are the exams going to be like?” in the first three minutes of Lecture 1. Four things follow from it, and they shape this whole guide:
| She said | What it means for you |
|---|---|
| “We always also give you the normal ranges … I’m not going to just throw a random number at you and not give you context of whether that’s high or low.” | Do not memorize reference values. If a lab value appears in a stem, its range appears with it — on this exam and, she said, in every class. Spend the effort on what the value means. |
| “It will be based on the instructional objectives … more related to the tests themselves rather than maybe the specific diagnosis.” | Study the test: what to order, why, its limits, how to read it. The objectives above are the blueprint. |
| “Although a heart rhythm can be a diagnosis, you also need to be able to interpret an EKG by naming the rhythm.” | The one stated exception. It lands on Lectures 7 and 11–16, so Exams 2 and 3. |
| “There could be pictures … images of x-rays or CT scans … in addition to the vignette.” | Expect image-based vignettes, not only text. |
Her question style, in her own words: “which of the following laboratory tests would be best to evaluate a patient with microscopic anemia?” · “what would be the next test that you would order?”
1.1 · Objectives a & b — The role of testing, and counseling the patient
Diagnostics are tools to gain additional information, used in conjunction with a thorough history and physical examination — not in place of them. They are not necessarily therapeutic, though a blood culture that returns sensitivities certainly can be.
| What testing does |
|---|
| Confirms a diagnosis · informs health status · evaluates disease severity · directs treatment · monitors response to therapy · guides ongoing care through regular screening |
Counseling is framed as error reduction, not courtesy. Patients who are informed and understand the plan are more likely to be compliant, and compliance is what makes the result meaningful. Education covers the testing process, their questions, and the anticipated timeline for results.
| Effective diagnostic testing |
|---|
| Communicate clearly · consider ethnicity, culture, gender and age · prepare the patient properly · follow standards · measure and evaluate outcomes · manage services with a team approach · interpret, treat, monitor and counsel on abnormal outcomes · maintain proper records |
Also tested
- Patient perceptions about testing. Understanding a patient's perceptions and anxieties allows communication on a deeper level so that a therapeutic relationship can develop. Empathy is expected throughout all phases of testing.
- Role of laboratory testing. It is a tool used alongside a thorough history and physical examination to add information. Diagnostics supplement the history and examination rather than replacing them.
1.2 · Objectives c & d — The three phases
Each phase has its own guidelines and standards, and each has its own characteristic failures.
| Phase | Also called | Span |
|---|---|---|
| Pretest | Preanalytical | Begins with patient preparation, extends until the test begins |
| Intratest | Analytical | Performing the test and everything it encompasses |
| Posttest | Postanalytical | Begins once the test is complete; focuses on aftercare |
| Pretest — what to consider | Pretest — how it fails |
|---|---|
| Review history and risk assessment · identify contraindications · assess coping styles, fears and phobias · observe universal precautions · document relevant data · cost and reimbursement · patient and family education · documentation · ethical and legal considerations, including consent | Communication errors · medication administration as directed · proper labeling · technical errors — inadequate blood in the vacuum tube, delay in transport, inappropriate preparation and storage · inappropriate patient preparation — fasting |
Variables that can affect results: patient preparation · current drug therapy · time of specimen collection · physical activity · hydration status · age · sex · body mass index.
| Intratest | Posttest |
|---|---|
| Specimen or tissue collection · monitoring the testing environment · performing or assisting the procedure · providing emotional and physical comfort · administering analgesics and sedatives · monitoring vital signs · universal precautions · proper collection · minimizing delays · monitoring for side effects or complications | Monitor for complications — bleeding, infection, respiratory difficulties, perforation, adverse effects of sedation or anesthesia · interpret results and the patient's response · identify and treat critical values · communicate results clearly and sensitively |
Also tested
- Intratest phase. The intratest phase covers performing the test and everything it encompasses, such as monitoring vital signs and administering analgesics or sedatives during the procedure.
1.3 · Objective e — Collection tubes and the order of draw
The deck carries a two-dozen-row table pairing every additive to every stopper color. She does not want it memorized. “The thing I want you to know better, have a better handle on, is kind of the order and sort of the broad category — so light blue, think coags; lavender, we’re gonna be using this for like our CBC.” Then: “the order is important. I kind of want you to have an idea of the order.”
Her test of whether you know it: if you ordered coagulation studies and someone walks in with a lavender tube, you should immediately know that is the wrong tube.
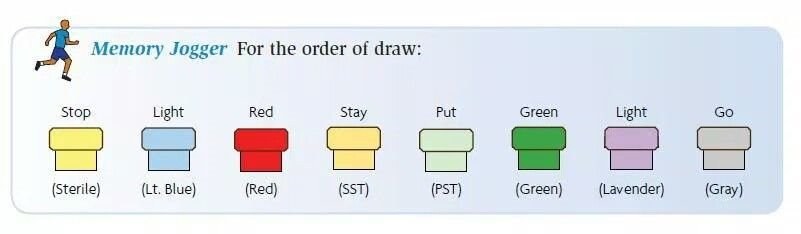
| Order | Tube | Contents | Think |
|---|---|---|---|
| 1 | Yellow | Sterile media | Blood cultures |
| 2 | Light blue | Sodium citrate | Coagulation studies |
| 3 | Red | Non-additive serum tube | Serum chemistry |
| 4 | Gold / tiger | Serum separator | Serum chemistry |
| 5 | Green | Heparin | Plasma chemistry |
| 6 | Lavender | Ethylenediaminetetraacetic acid | Complete blood count |
| 7 | Gray | Glycolytic inhibitor | Glucose |
1.4 · Objective f — Stool, blood, sputum and throat studies
| Study | Purpose and use | The detail that gets tested |
|---|---|---|
| Stool studies | Non-invasive; diagnostic or screening. Indications: diarrhea, excessive flatus, abdominal discomfort, change in stool color, recent travel, well water, prolonged antibiotics. Identifies overgrowth of normal flora, toxins, acquired bacteria, parasites | Specimen must be uncontaminated with urine or other secretions, in a dry clean container |
| Ova & parasites | Part of stool studies | Do NOT refrigerate — warm stool is best. Three separate random specimens, because of the parasite life cycle |
| Guaiac | Detects fecal occult blood; from a specimen or from the gloved finger after digital rectal examination | Heme oxidizes the hydrogen peroxide in the guaiac → blue = positive. Use a small sample; a large one obscures the result |
| Blood cultures | Acute febrile illness with suspicion of septicemia. Both diagnostic and therapeutic — identifies the pathogen and gives sensitivities | Two separate samples from opposite arms, ideally before antibiotics. Aerobic first. Scrub and let dry; do not palpate after disinfection unless wearing sterile gloves |
| Sputum culture | Identifies respiratory pathogens and directs treatment | Two steps: Gram stain first (positive versus negative), then culture for identification and sensitivities. Sit upright, rinse mouth with water, three deep breaths, deep cough. Aerosols may assist. Acid-fast bacilli can be done from the same specimen |
| Throat culture | Isolates the pathogen, often streptococci, because of beta-hemolytic streptococcal pharyngitis. Most common ages 3–15; in adults, severe or recurrent sore throat, fever, palpable lymphadenopathy | Tongue blade improves visualization, relaxes the throat and reduces gag. Rotate the swab over the posterior throat, both tonsils, and any inflammation, exudate or ulceration. Avoid the tongue and lips. Rapid immunologic tests are highly accurate |
Also tested
- Stool specimen collection. The specimen must be free of urine or other bodily secretions such as menstrual blood, and collected into a dry, clean container.
- Three stool specimens for ova and parasites. Three separate random specimens are recommended because of the life cycle of parasites, which increases the likelihood of detection. Organisms are shed intermittently, so a single specimen can miss them.
- Culture specimens. For throat, sputum and blood cultures alike, obtain the specimen before initiating antibiotics whenever possible, since antibiotics reduce the yield.
- Blood culture technique. After the puncture site has been disinfected, avoid palpating the site unless sterile gloves are worn, because palpation recontaminates it.
- Inducing sputum. For a patient who cannot produce a specimen, aerosols such as sterile water, saline or albuterol help loosen and induce secretions.
1.5 · Objectives g, h & j — Point-of-care testing
Definition: medical testing completed outside the centralized laboratory, at or close to the site of patient care. Also called near-patient, remote, satellite laboratory testing, or rapid diagnostics. Traditional testing is multi-step and delays treatment; this brings the laboratory to the patient.
| Universal features |
|---|
| Simple to use · reagents durable in storage and use · results align with established laboratory methods · safe during testing · performable by medical assistants, first responders, physicians, physician assistants, nurses and others — some by non-medical individuals at home |
| Common in primary care | Common in acute care |
|---|---|
| Blood glucose · hemoglobin A1c · urinalysis · rapid influenza · rapid strep · fecal occult blood · pregnancy testing · cholesterol · prothrombin time with international normalized ratio · drug screening Rapidly increasing: fentanyl and human immunodeficiency virus testing | Venous blood gas · point-of-care glucose · troponin · brain natriuretic peptide · D-dimer · prothrombin time with international normalized ratio · hemoglobin and hematocrit · rapid antigen tests · urine human chorionic gonadotropin · urinalysis dipsticks Machines: portable x-ray, electrocardiography, pulse oximetry, ultrasound |
| Advantages | Limitations |
|---|---|
| Convenience · rapid, less manpower · reduced visits · fingerstick rather than needle stick · better care where resources are limited — rural, disaster zone | Expensive · quality assurance difficult to control · operator and manufacturer variability · vocabulary not always standardized · results may be less precise · supply needs |
Also tested
- Growing point-of-care testing. Fentanyl testing and human immunodeficiency virus testing are the two areas of point-of-care testing noted as rapidly increasing.
1.6 · Objective i — Qualitative versus quantitative
| Qualitative | Quantitative | |
|---|---|---|
| Answers | “Why” questions | “How many / how much” questions |
| Data | Observation, description | Numbers, statistical results |
| Approach | Observe and interpret | Measure and test |
| Analysis | Grouping of common data; non-statistical | Statistical analysis |
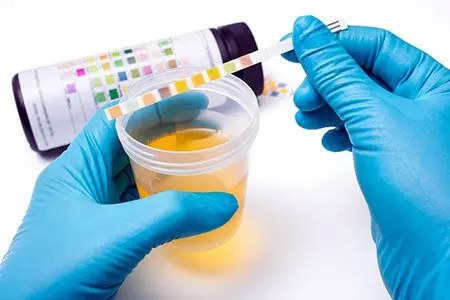
| Analyzer type | Examples |
|---|---|
| Qualitative or semi-quantitative cartridge | Rapid strep (qualitative), influenza (qualitative), urinalysis dipstick (semi-quantitative), pregnancy (qualitative) |
| Single-use quantitative cartridge or strip with a reader | Glucose — the highest-volume point-of-care test, blood chemistries, coagulation, cardiac markers, C-reactive protein, hemoglobin A1c, arterial blood gases, electrolytes |
| Multiple-use quantitative cartridge / benchtop | Hemoglobin species with arterial blood gas, bilirubin, electrolytes, cardiac markers, drugs |
Non-instrumental point-of-care testing does not rely on instrumentation to interpret the result — urine pregnancy, coronavirus tests, fecal occult blood. Handheld equipment is easy to carry, one to two steps, few data points. Benchtop devices are stationary, multi-step, multiple data points. Both usually need reagents and consumables.
1.7 · Objectives k & l — Quality assurance and regulation
| Quality measures for point-of-care testing |
|---|
| Supervising testing and delivery of results · operators trained and competent · collection per the device instructions · accurate patient identification throughout testing and reporting · quality control · active enrollment in an External Quality Assurance program · devices connected to electronic information systems to minimize post-testing errors · a safe, secure working environment |
Clinical Laboratory Improvement Amendments (CLIA) — federal guidelines setting minimum quality standards for testing human samples at all types of sites. It began in the late 1960s after problems in the cytology laboratories reading Papanicolaou smears.
| Complexity category | What it means |
|---|---|
| Waived | Little chance of a negative outcome from a false result. The Joint Commission classifies all testing outside a traditional laboratory as waived — that is, point-of-care testing |
| Moderately complex | The majority — roughly 75% of the 12,000 available tests. Usually automated |
| Highly complex | Requires operator skill and decision making; not fully automated; complex instrumentation, such as cross match testing |
| Provider-performed microscopy | Slide examination of a freshly collected specimen by a provider — Gram stain, manual cell count |
| Agency | Role |
|---|---|
| Centers for Medicare & Medicaid Services | Issues certificates · collects user fees · inspects and enforces · approves accreditation organizations · monitors proficiency testing · publishes the rules |
| Food and Drug Administration | Categorizes tests by complexity · reviews waiver applications · develops categorization guidance |
| Centers for Disease Control and Prevention | Analysis, research and technical assistance · technical standards and practice guidelines · quality improvement studies · manages the advisory committee |
Also tested
- Screening tests. They are typically inexpensive and easy to perform and indicate whether further testing is needed. Screening should be performed before more expensive or time-consuming tests.
1.8 · Objective n — Screening versus diagnostic
| Screening | Diagnostic | |
|---|---|---|
| Who | Asymptomatic person — looking for evidence of disease | Person with symptoms — looking for the reason |
| Character | Typically inexpensive, easy to perform | May be more invasive, with risk of complications |
| Output | Indicates whether more testing is needed; not necessarily a diagnosis | Confirmation — the “definitive” diagnosis |
| Sequence | Do this first, before the expensive or time-consuming test | Follows an abnormal screen, or investigates symptoms directly |
1.9 · Objectives m & o — Sensitivity, specificity and predictive value
Walking the shark-bite example, she stopped before the numbers: “What do we think the percentage — we don’t, we’re not gonna do math, I’m not gonna make you do math” — and then asked only which scenario has the higher positive predictive value.
So learn the direction and the reason, not the formula. The worked figures below are here to make the reasoning concrete, not to be recomputed.
| Sensitivity | Specificity | |
|---|---|---|
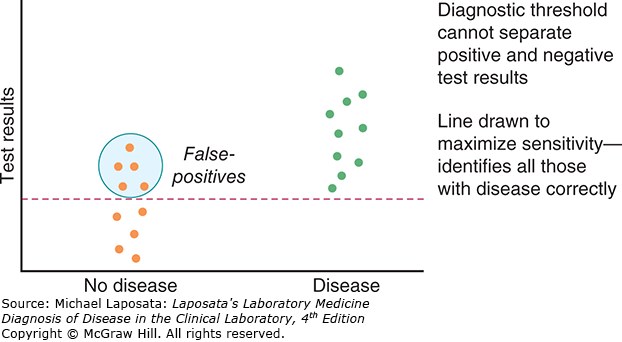
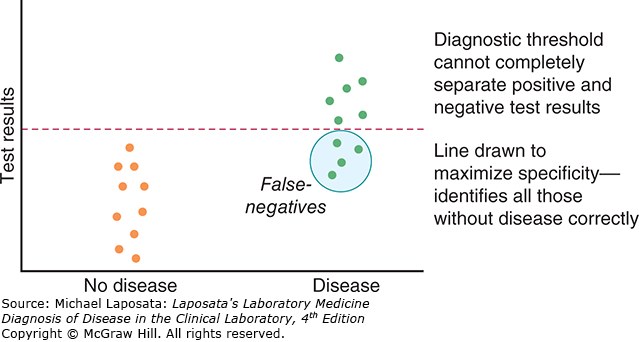
| Measures | Test is positive when the person does have the condition | Test is negative when the person does not have the condition |
| Good at | Detecting disease | Excluding disease |
| Fewer | False negatives does not address false positives | False positives does not address false negatives |
| Mnemonic | SnNout — high Sensitivity + Negative rules out | SpPin — high Specificity + Positive rules in |
| Best for | Screening | Confirming |
| Example | Human immunodeficiency virus screening — very few infected individuals are missed | Human immunodeficiency virus confirmatory testing — minimizes false-positive diagnoses |
| Measure | Question it answers | Belongs to |
|---|---|---|
| Sensitivity | If the disease is present, will the test be positive? | The test — test-centered |
| Specificity | If the disease is absent, will the test be negative? | |
| Positive predictive value | My patient’s test is positive — do they actually have it? | The population — patient-centered |
| Negative predictive value | My patient’s test is negative — are they actually clear? |
| Frostbite in January, same test, 95% sensitivity and 95% specificity |
|---|
| Michigan — prevalence about 10%. Of 1000 tested: 95 true positives against 45 false positives → positive predictive value about 68% |
| Florida — prevalence about 0.1%. Of 1000 tested: about 1 true positive against 50 false positives → positive predictive value about 2% |
Then she reversed it. A shark-bite detector, same 95% and 95%: in Florida a positive has a reasonable chance of being real; in Michigan, where shark bites are vanishingly rare, most positives are false. The tests are identical. The pre-test probability is what changed.
| Term | Meaning |
|---|---|
| Pre-test probability | Likelihood of the condition before the result — from signs, symptoms, history, risk factors and how common it is in the population |
| Post-test probability | Likelihood after the result — depends on sensitivity and specificity |
| Prevalence | How commonly something occurs; existing cases, usually a percentage |
| Incidence | How often something happens — not how commonly |
Also tested
- Interpreting chemistry results. A lab value shifts the probability of the diagnoses under consideration, narrowing the differential and directing the next test rather than being diagnostic by itself.
- Abdominal series. It evaluates enteric pathology, with the named examples being small bowel obstruction, perforation and volvulus.
- Positive predictive value. It is the likelihood that a positive test result identifies someone with the disease; negative predictive value is the likelihood that a negative result identifies someone without it.
- Pre-test probability. It indicates the chance the condition is present beforehand, which helps decide whether the test is worth ordering at all; the judgment comes from the patient's presentation and risk factors.
- Prevalence and positive predictive value. With the same test (95% sensitivity and 95% specificity), positive predictive value is higher in a high-prevalence population and lower in a low-prevalence one, as in the frostbite example: 68% versus about 2%.
- Screening for human immunodeficiency virus. A highly sensitive test comes first because it is better to have a few false positives, later corrected by a highly specific confirmatory test, than to miss infected individuals who might unknowingly infect others.
- Specificity and error type. Specificity relates to fewer false positives; it does not address false negatives.
2 · Principles of Medical Imaging
Instructional Objectives
Topic Outline 2: Principles of Medical Imaging
- Identify the fundamental properties of medical imaging.
- Describe the function and clinical applications of: Radiography, Ultrasonography, Computed Tomography (CT), Magnetic Resonance Imaging (MRI), Magnetic Resonance Angiography (MRA), Positron Emission Tomography (PET), Single Photon Emission Computed Tomography (SPECT), Angiographic studies.
- Discuss anatomical structures best visualized by each imaging modality.
- Compare and contrast the concepts of radiographic density and contrast.
- Discuss the importance of patient positioning in medical imaging.
- Compare and contrast the risks and benefits associated with radiation exposure.
- Compare and contrast the risks and benefits associated with contrast administration.
- Discuss contraindications and safety considerations of commonly used imaging modalities.
- Discuss the importance of communication between the physician assistant and radiology team.
108 minutes of audio, cross-examined against Notability’s own transcript. On the question that matters most — what is not examinable — the two transcriptions agree exactly, and there is only one such statement in the whole lecture.
| She said | What it means for you |
|---|---|
| “The most important thing, and this is totally like a, like don’t stress about this. This is not gonna be on the test. This is just like a life thing… if you’re trying to trend somebody’s magnetic resonance images” [1:02:11] | The only de-emphasis in the lecture. Keeping a patient on the same scanner so serial studies stay comparable — her example was repeating scans every six months in multiple sclerosis — is practice, not exam material. |
| “You need to know what the view is when you’re looking at it, so that you can kind of decide, like, is this actually cardiomegaly or not?” [1:14:06] | The posterior-anterior versus anterior-posterior distinction is not trivia about beam direction. Read an anterior-posterior film as if it were posterior-anterior and you will call cardiomegaly that is not there. She adds the practical corollary: a sick inpatient who cannot stand gets an anterior-posterior film, so this comes up constantly. |
| “There’s your like buzzword phrase, free air under the diaphragm, perforated bowel.” [1:22:50] | She called this one a buzzword out loud, which is as close to a flag as this lecture gets. Free air under the diaphragm = perforated bowel — unless they have had recent laparoscopic surgery with insufflation and have not yet absorbed the gas. With belly pain, fever, nausea and vomiting and no recent surgery, it is perforation. The abdominal film is taken upright precisely so air floats up and fluid settles down. |
| “You also need to know renal function, but for kind of a different reason. Gadolinium is not necessarily nephrotoxic. It can be, but the issue is clearance of it… then it will build up in their tissues and then that is toxic. Magnetic resonance, computed tomography, kidney function, check it.” [1:40:24] | This refines the slide. The deck says gadolinium can cause kidney damage but is not as harmful as computed tomography contrast. The mechanism she wants is different: with iodinated contrast the agent is nephrotoxic; with gadolinium the kidney is the route of clearance, and impaired clearance lets it accumulate in tissue where it becomes toxic. Either way, check renal function before either. |
| “There should not be cross-reactivity for a shellfish allergy and iodinated radiocontrast. However, if they have an iodine allergy, absolutely you worry about allergy. But when in doubt, you’re gonna pretreat.” [1:39:11] | An important refinement on a slide that states the rule bluntly. Shellfish allergy is not iodine allergy — but a genuine iodine allergy is a concern. Her actual clinic question is: “do you have an iodine allergy, yes or no?” And when in doubt you pretreat — diphenhydramine and prednisone at intervals beforehand, plus fluids. |
| “Contrast media… They are also radiation. The contrast media itself can also increase cancer risk. It’s all carcinogenic.” [27:38] | She stated the deck’s carcinogenicity point flatly and tied it to the diagnostic approach: “that’s why one of the questions… is, can we do this without contrast?” Not accurate as stated. Iodinated and gadolinium agents are radiopaque, not radioactive, and are not carcinogenic themselves. The cancer risk of a contrast study comes from the ionizing radiation of the x-ray-based technique; only nuclear medicine tracers such as technetium-99 are radioactive. |
| “Neoplastic agents make more blood vessels grow in that site… they become more vascularized compared to the surrounding tissues. So you inject intravenous contrast, and that tumor’s gonna light up when it’s malignant.” [1:27:54] | The mechanism the slide only implies. Contrast delineates a neoplastic from a benign mass because malignancy recruits its own vasculature. The same logic explains why an abscess enhances — inflammation, edema and increased blood flow to the area. |
| “In primary care, you should never ever order that… you better have sent them to a specialist. Very dangerous.” [27:11] | On injecting contrast into a pregnant uterus. If you have reached the point of needing it, the patient has already been referred. |
| “You’re going to choose which side based on which direction you want to view fluid… we use decubitus positioning a lot to layer out fluid.” [1:17:47] | Decubitus is not one position but a choice of side, made according to where the fluid should run. |
| “Yes, you can memorize, I do a computed tomography pulmonary embolism protocol for pulmonary embolism… But if you’re like, I don’t really know for sure what this patient has, but I think something’s wrong with their bones — you’re definitely gonna pick either an x-ray or a computed tomography over an ultrasound.” [1:10:31] | Her stated method for objective c. Memorized protocols are fine, but the reliable move is to reason from the tissue: bone → x-ray or computed tomography; soft tissue → often start with ultrasound. This is also why slide 34’s structures table matters less than knowing the principle. |
Quoted from the 19 August 2026 lecture recording, with timestamps. Where the recording and the slide disagree on a number, the slide wins — but where the recording explains a mechanism the slide only asserts, the recording is the better teacher.
2.1 · Objective a — Fundamental properties & the diagnostic approach
Wilhelm Röntgen discovered x-rays in Germany in 1895 and took the first Nobel Prize for Physics for it in 1901 — which is why the technique is still called roentgenography. Every modality since answers the same four questions before it is ordered:
| The question | What it is really asking |
|---|---|
| Which modality is best for ruling the diagnosis in or out? | Match the study to the tissue and the question, not to habit. |
| Is there an alternative with less radiation? | Ultrasound and magnetic resonance use none at all. |
| Risk versus benefit, and patient-specific implications? | Pregnancy, age, renal function, implanted devices. |
| Does this need contrast, or can it be non-contrast? | Contrast adds information and adds risk. |
A conventional radiograph is an image made with ionizing radiation and without added contrast such as barium or iodine. It needs a source, a way to record the image and a way to process it; radiation and light strike a photosensitive surface, producing a latent image that is processed to become visible. Radiographs are quick, inexpensive and obtainable anywhere, which is why they are the most widely obtained imaging studies — against a limited range of densities and a reliance on ionizing radiation, albeit at relatively low dose.
Also tested
- Choosing an imaging modality. Ask which modality best rules the diagnosis in or out, whether there is a lower-radiation alternative, what the risk against benefit is for this patient, and whether contrast is needed.
2.2 · Objective b — The modalities, one at a time
| Modality | How the image is made | Advantages | Disadvantages |
|---|---|---|---|
| Radiography | Ionizing radiation through the body onto a detector, viewed in two dimensions | Quick, inexpensive, available anywhere, portable | Only five densities; ionizing radiation; structures overlap |
| Computed tomography | Powerful x-ray beams through a rotating fan beam, measuring transmission at thousands of points | Expands the gray scale beyond five densities, reduces overlap, works with implanted devices, three-dimensional reconstruction; the cornerstone of cross-sectional imaging | Not truly portable, a lot of ionizing radiation, needs space and heavy processing |
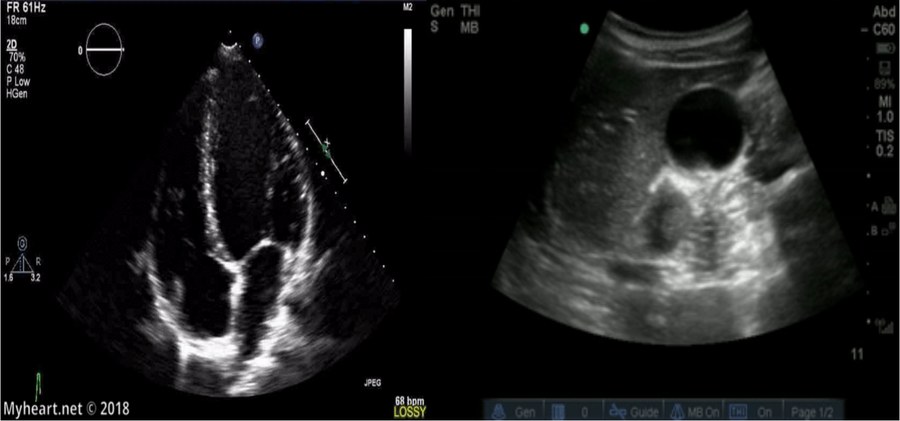
| Ultrasonography | High-frequency sound from a transducer, bounced off tissue and back to it | Inexpensive, portable, no radiation, real time, color Doppler for flow direction and velocity | Cannot penetrate bone, gas disrupts the signal, deep structures are hard, operator-dependent |
| Magnetic resonance | A varying magnetic field aligns hydrogen; releasing it emits radio waves — essentially a hydrogen map | No radiation, superior to computed tomography for soft tissue, calcium is silent so tissue inside bone is visible, diffusion-weighted imaging for stroke | Not widely available, expensive, slow, magnetic implants and ferromagnetic projectiles |
| Positron emission tomography | Gamma camera reading an injected tracer, usually fluorodeoxyglucose-18; two-dimensional | Shows which tissues consume more glucose — cancer staging, brain disorders, cardiac blood flow | Among the highest-emitting devices in existence |
| Single photon emission tomography | Gamma cameras on a rotating gantry reading single photons; three-dimensional | Shows where blood flows — heart disease, bone scans, brain evaluation | Among the highest-emitting devices in existence |
| Angiographic studies | Not one test: x-ray angiogram, color Doppler, computed tomography angiography, magnetic resonance angiography | Images vessels by whichever modality suits; magnetic resonance angiography and venography need no dye at all | Inherits the risks of whichever modality is used |
| Fluoroscopy | Ionizing radiation giving real-time video of the body | Evaluates motion and positioning; watches barium or iodine move through the gut, urinary tract and vessels | Needs a specially fitted unit with a tilting table; continuous radiation |
Also tested
- Kidneys on a bone scan. Renal uptake is a normal finding. Positron emission tracer is likewise renally cleared, so the urinary tract always appears on those scans.
- Fluoroscopy equipment. It requires an x-ray unit fitted for controlled motion of the source, the imaging sensor and the patient, with a tilting table; the tube moves freely back and forth to image the patient.
- Venogram. This is the angiographic study of the veins rather than the arteries, and it is performed as either a magnetic resonance venogram or a computed tomography venogram.
- Open magnetic resonance scanner. Open scanners are available, but the price paid for the open configuration is decreased quality of imaging.
- Magnetic resonance signal. The frequency of the radio waves read depends on both the chemical environment of the hydrogen atoms and their location, which lets the computer build a spatial map.
- Magnetic resonance imaging safety. No radiation is emitted, but the magnet creates hazards: magnetic implanted devices and ferromagnetic projectiles; it is still not recommended in pregnancy or infants.
- Diffusion-weighted imaging. This programmable magnetic resonance technique is useful in stroke; it evaluates the diffusion of water within tissue, and the scanner can also be programmed to evaluate blood velocity.
- T2-weighted image. Tissue with high water content appears bright; examples are fat, edema, infection, blood and cerebrospinal fluid. Water is white on T2.
- Color Doppler. It adds direction of flow and velocity to an ultrasound image otherwise made of white, gray and black; color is the flow overlay, used for blood.
- Magnetic resonance imaging versus computed tomography near bone. Magnetic resonance imaging shows tissues surrounded by bone better because calcium emits no signal, so the bone does not obscure what sits inside it; that silence is an advantage rather than a gap.
2.3 · Objective c — Which study for which structure
| What you want to see | What the deck says to use |
|---|---|
| Moving structures — heart, vasculature, obstetrics | Ultrasound, which records in real time |
| Female pelvis, and pediatric patients | Ultrasound, often the first study of choice; also for image-guided procedures |
| Soft tissue — essentially anything other than bone | Magnetic resonance, with extremely high anatomical detail |
| Brain, and the soft tissues of orthopedics — muscle, ligament, tendon | Magnetic resonance; it is the cornerstone of neuroimaging |
| Tissue surrounded by bone | Magnetic resonance — calcium emits no signal, so the bone does not obscure it |
| Anything cross-sectional | Computed tomography, the foundation of cross-sectional imaging |
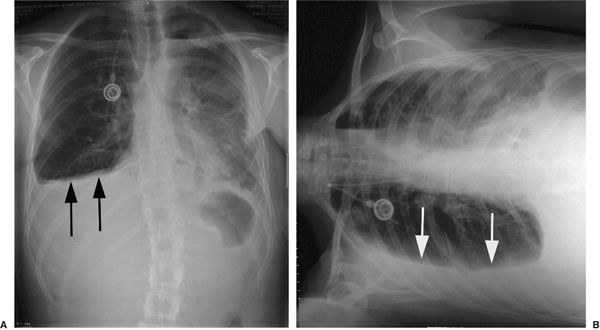
| Pleural effusion | Chest radiograph in the decubitus position, so the fluid layers out |
| Genitourinary tract | Kidney-ureter-bladder film — supine, anterior-posterior |
| Gastrointestinal tract, free air, air-fluid levels | Abdominal series — standing, anterior-posterior; for obstruction, perforation, volvulus |
| Which organs are consuming glucose | Positron emission tomography |
| Where blood is flowing | Single photon emission tomography, or color Doppler |
Also tested
- Choosing a modality. When the diagnosis is uncertain, reason from the tissue rather than a memorized protocol: computed tomography suits bone, magnetic resonance is best for soft tissue, and ultrasound cannot penetrate bone or gas-filled structures.
- Ultrasonography indications. Assessment of moving structures, naming the heart, the vasculature and obstetrics; it records in real time, which suits it to motion.
- Ultrasound as first study. It is often the first study of choice in the female pelvis and pediatric patients, and it is also used to guide procedures; no radiation is the reason it leads in both groups.
2.4 · Objective d — Density, contrast & the Hounsfield scale
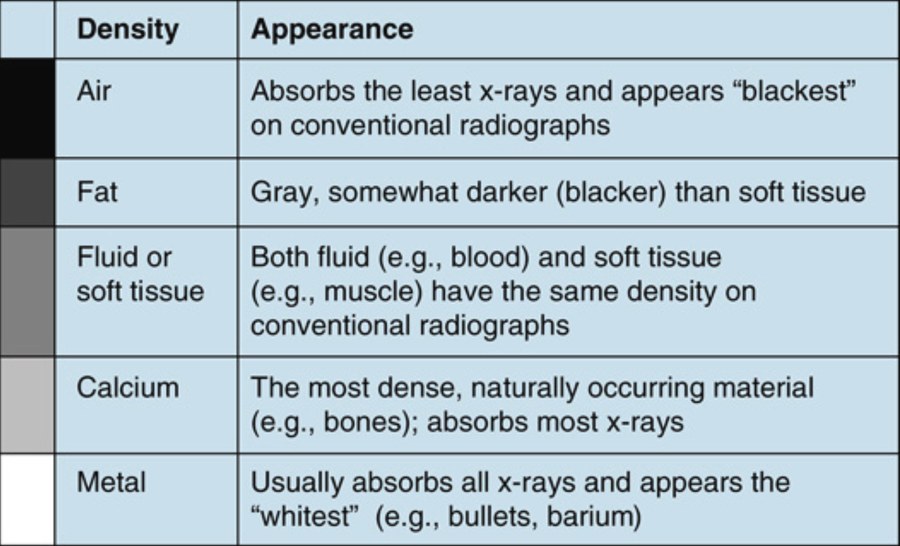
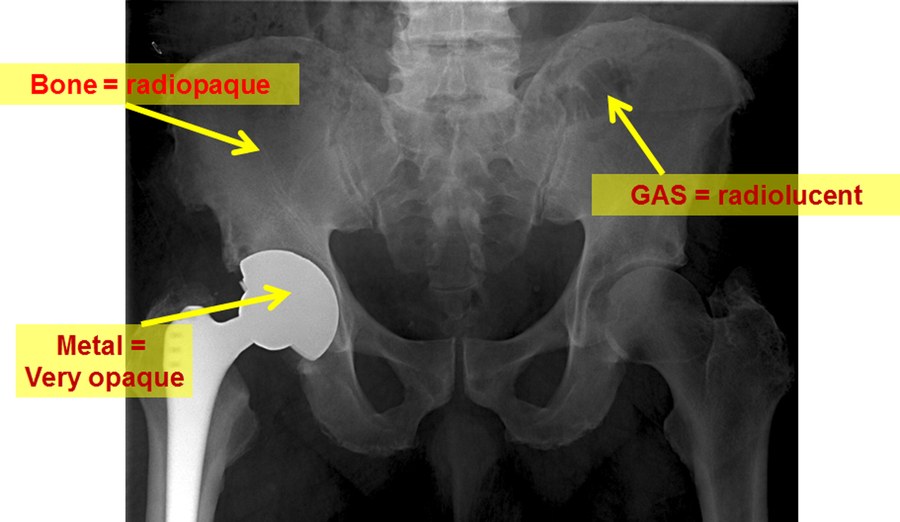
The vocabulary. Radiolucent and hypodense both mean the image looks darker, because more x-ray photons passed through and less was absorbed. Radiopaque, hyperdense and radiodense all mean it looks whiter, because less passed through and more was absorbed. Radiation itself is measured in millisieverts and milligrays.
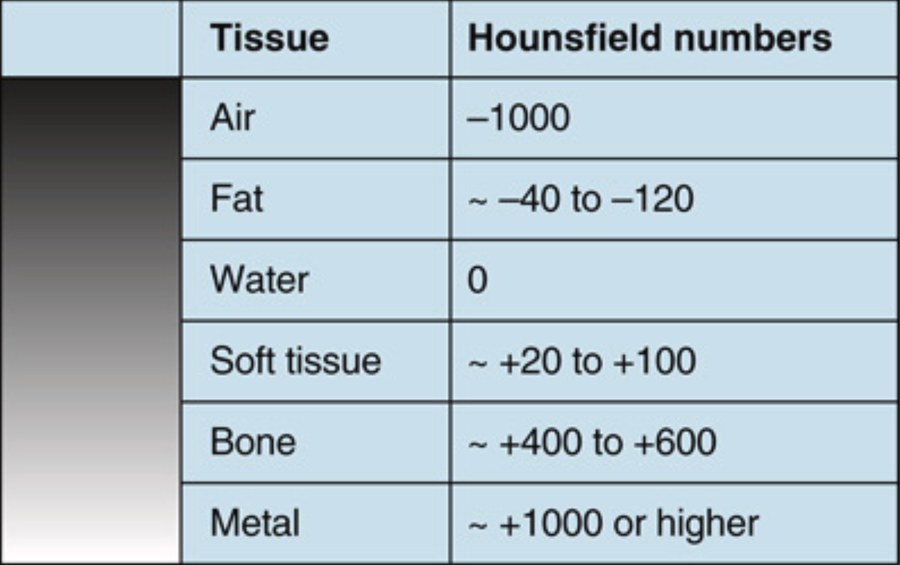
A computed tomography image is a matrix of thousands of tiny squares — pixels — each assigned a number from −1000 to +1000 in Hounsfield units, according to how much of the beam that point absorbed. Water is zero by convention and everything else is placed relative to it.
| Term | On computed tomography | The same substance on a plain film |
|---|---|---|
| Increased attenuation | High Hounsfield number, appears whiter — metal, calcium | Increased density; more opaque, radiopaque |
| Decreased attenuation | Low Hounsfield number, appears blacker — air, fat | Decreased density; increased lucency |
Also tested
- Radiopaque tissue. Tissue that absorbs more of the beam appears white, because less passage of x-ray photons produces the whiter appearance. It is also called hyperdense or radiodense.
- Computed tomography advantages. It expands the gray scale beyond the five basic densities, reduces overlapping of structures, works with implantable devices, and allows three-dimensional reconstruction; it is the cornerstone of cross-sectional imaging.
- Computed tomography data acquisition. Powerful x-ray beams pass through the patient via a rotating fan beam, measuring transmission at thousands of data points; a computer then processes the data through algorithms into diagnostic images.
- Fat on the Hounsfield scale. With water at zero, fat sits at roughly minus forty to minus one hundred and twenty, so it reads darker than soft tissue but lighter than air; fat is negative, but nowhere near as negative as air.
- Densities on a radiograph. Bone is radiopaque, gas is radiolucent, and a metal prosthesis is very opaque, showing three of the five densities at once.
- Hounsfield sequence of tissues. From the most negative to the most positive number the order is air, fat, water, soft tissue, bone, metal, which runs blackest to whitest in exactly that order.
- Most dense natural material. Calcium is the most dense naturally occurring material; it absorbs most x-rays, though metal absorbs essentially all of them.
2.5 · Objective e — Positioning & the imaging planes
Projections are named in the direction the beam travels, from what it strikes first to the most distal portion. So posterior-anterior means the beam enters the back and leaves the front.
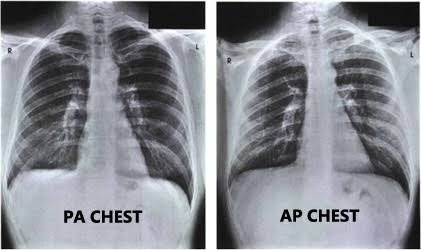
| Position | How | What it is for |
|---|---|---|
| Posterior-anterior | Standing, beam from behind; usually combined with a lateral | The standard chest film |
| Lateral | Side-on; the patient faces to the left on the view | Read together with the posterior-anterior film |
| Lateral decubitus | Lying on one side | Pleural effusion — the fluid levels out with gravity |
| Anterior-posterior | Beam from the front | Used when a patient cannot stand for a posterior-anterior film |
| Kidney-ureter-bladder | Supine, anterior-posterior | Genitourinary tract |
| Abdominal series | Standing, anterior-posterior | Gastrointestinal tract; air-fluid levels, free air, obstruction, perforation, volvulus |
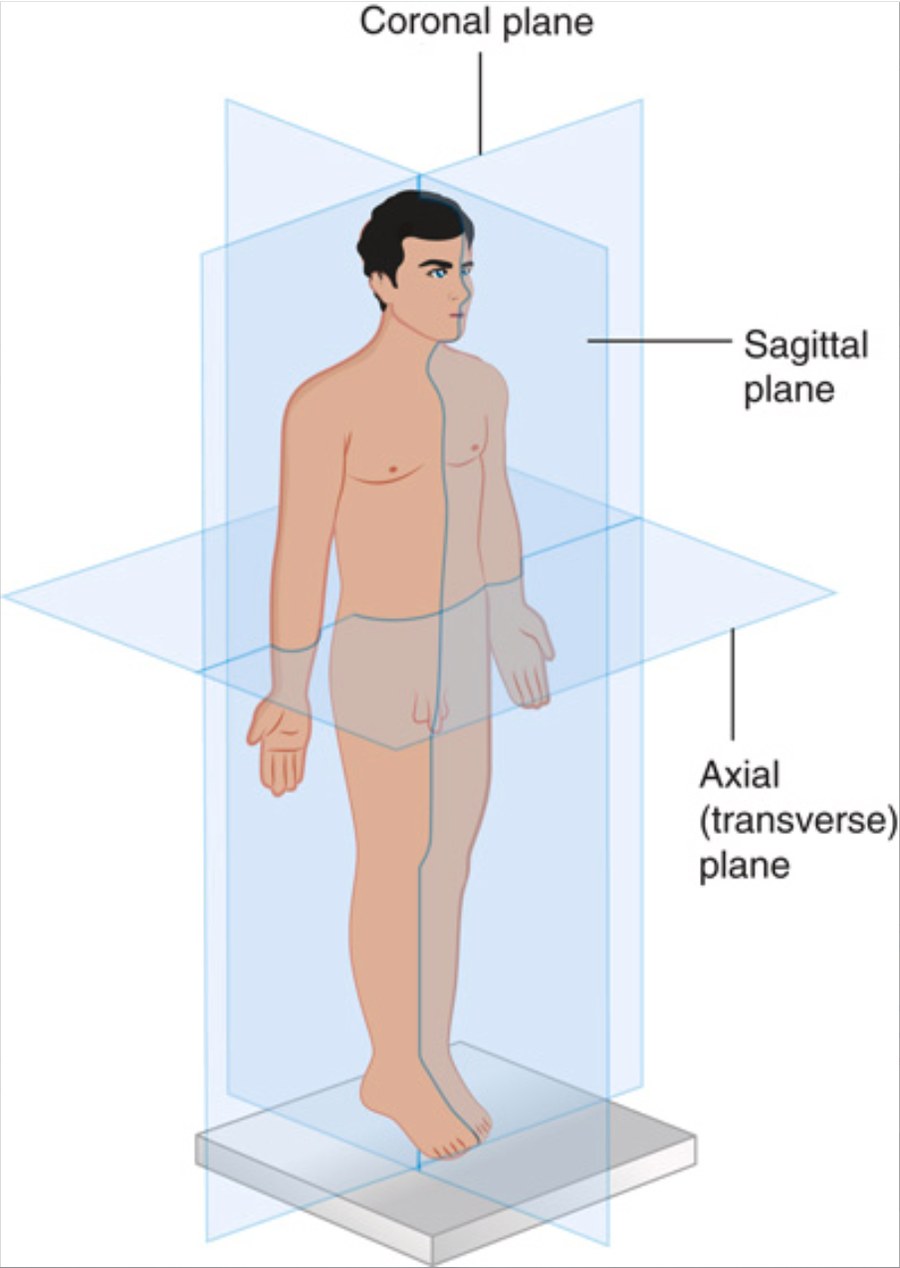
For computed tomography, nuclear medicine and magnetic resonance the patient is supine, and traditional images are transverse sections viewed as if you were looking at the patient's feet — so the patient's left side is on the reader's right. Ultrasound has dozens of positions depending on the structure and the complaint, most of them some variety of supine.
Also tested
- Anterior-posterior chest film. It is used for a sick inpatient who cannot stand or get out of bed. It magnifies the heart, so it must not be read for cardiomegaly like a posterior-anterior film.
- Posterior-anterior chest view. Beyond the heart, it gives maximum visualization of the lung, better visualization of the apices, and well visualized posterior ribs.
2.6 · Objective f — Risks & benefits of radiation exposure
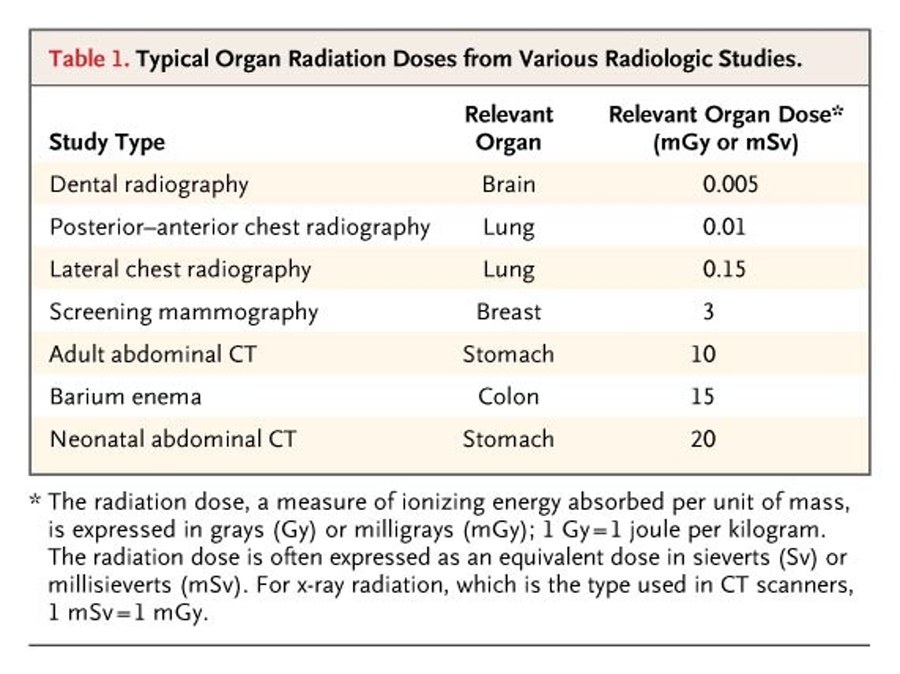
Dose is ionizing energy absorbed per unit of mass, expressed in grays or milligrays — one gray is one joule per kilogram — and often as an equivalent dose in sieverts or millisieverts. For the x-ray radiation used in computed tomography scanners, one millisievert equals one milligray, which is why the table above can label a single column with either.
Nuclear medicine is different in kind, not just in amount. In every other modality the machine is the source and the exposure stops when the study stops. In nuclear medicine the tracer is inside the patient, so for a while the patient is the source — they can briefly expose other people. That is the one radiation fact unique to these studies.
Also tested
- Highest typical organ radiation dose. Among typical organ doses, neonatal abdominal computed tomography, to the stomach, is the highest at about 20 millisieverts, twice the 10 of the adult abdominal scan.
- Lateral versus posterior-anterior chest radiograph. The lung dose of a lateral chest radiograph is higher, about 0.15 millisieverts against 0.01; reducing dose to radiation-sensitive organs is one reason the posterior-anterior view is the preferred projection.
2.7 · Objectives g & h — Contrast media, contraindications & safety
Contrast is used most often to image arteries or veins, and to delineate and characterize masses — neoplastic against benign, infectious abscess against cyst. It also shows inflammation, increased blood flow and increased cellular or metabolic activity, and outlines luminal structures when given by mouth or as an enema. It can be injected into joints (arthrogram), into the central nervous system (intrathecal) and into the bladder (retrograde pyelogram). The deck calls the dyes “technically radioactive” and names cancer as a risk factor for all contrast material. That is not accurate: iodinated and gadolinium agents are radiopaque, not radioactive, and are not carcinogenic themselves. The cancer risk of a contrast study comes from the ionizing radiation of the x-ray-based technique (radiography, fluoroscopy, computed tomography); only nuclear medicine tracers such as technetium-99 are radioactive.
| Study | Agent | Before you give it | Watch for |
|---|---|---|---|
| Computed tomography, intravenous | Omnipaque (iohexol) — an iodinated agent, radiopaque rather than radioactive (the slide’s “radioactive form of iodine” is an error; only nuclear medicine tracers are radioactive). | Check blood urea nitrogen and creatinine; give one liter of normal saline to protect the kidneys | Nephrotoxicity. Indicated for inflammation, cancer staging, tumor delineation, vasculopathy, emboli, thrombi, stenosis, aneurysm |
| Angiography | Iohexol arterially, lower concentration than for intravenous computed tomography; iso-osmolal iodixanol (Visipaque) believed safer | Same renal checks | Same iodinated risks |
| Computed tomography, oral | Barium, or Gastrografin | Barium is contraindicated if perforation is suspected — use Gastrografin | Barium is toxic to extra-intestinal tissue and causes alkaline burns. Unpleasant taste |
| Fluoroscopy swallow study | Oral barium, with sequential films | Same perforation caveat | Same |
| Magnetic resonance | Gadolinium | Assess blood urea nitrogen and creatinine regardless — renal function matters mainly for clearance | Can damage kidneys, but not as harmful as computed tomography contrast. For central nervous system tumors, metastases, soft tissue masses, arthrograms. Magnetic resonance angiography and venography need no contrast |
| Positron emission tomography | Fluorodeoxyglucose-18 | Nothing specific | No contraindications, not known to be nephrotoxic; may cause hyperglycemia; renally cleared, so the genitourinary tract is always contrast positive |
| Single photon emission tomography | Technetium-99 | Nothing specific | Allergic reactions rare, no organ damage documented. Bone scans, myocardial perfusion, functional brain imaging, immunoscintigraphy, sentinel node identification, white cell uptake |
Also tested
- Positron emission tomography tracer. It typically uses fluorodeoxyglucose-18, a radioactive glucose, because tumors have a higher metabolic rate; the scan shows which tissues are consuming more glucose.
- Renal function before gadolinium. The concern is primarily clearance: poor function lets it build up in tissue. It can cause kidney damage, but less than computed tomography contrast, which is nephrotoxic.
- Cancer risk of contrast-enhanced computed tomography. It lies in the ionizing radiation of the scan; iodinated and gadolinium contrast agents are radiopaque, not radioactive, and not carcinogenic themselves, while only nuclear medicine tracers such as technetium-99 are radioactive.
2.8 · Objective i — Working with the radiology team
- The radiologist has not seen the patient. Whatever you give them is what guides the read, so give as much relevant clinical information as you can.
- A vague report is a conversation, not a dead end. Contact the radiologist and discuss the patient.
- If you do not know which study to order, say what you are looking for. They can guide the choice; that is what the relationship is for.
- Imaging several regions may mean several orders — magnetic resonance of brain, cervical spine, thoracic spine and lumbar spine is four requests, not one.
Also tested
- Ordering imaging of several regions. Multiple body parts or sections may mean multiple orders; brain, cervical, thoracic and lumbar spine is the example, so one clinical question can require four separate requests.
3 · Diagnostic Testing for Dermatologic, Ophthalmologic and ENT Disorders
Instructional Objectives
Topic Outline 3: Diagnostic Testing for Dermatologic, Ophthalmologic, and ENT Disorders
- Discuss indications, advantages, and limitations of common diagnostic tests used in dermatologic disorders.
- Describe indications for skin cultures and wound cultures.
- Interpret potassium hydroxide (KOH) preparations.
- Discuss indications for skin biopsy and common biopsy techniques.
- Discuss the role of diagnostic testing in evaluation of soft tissue infections and abscesses.
- Describe indications and interpretation of: i. Visual acuity testing · ii. Fluorescein examination · iii. Tonometry · iv. Visual field testing
- Discuss indications for: i. Rapid streptococcal testing · ii. Throat cultures · iii. Audiometry · iv. Tympanometry
- Compare and contrast CT and MRI applications in head and neck pathology.
- Select appropriate imaging studies for common ophthalmologic and ENT disorders.
- Identify common abnormalities of the orbit, sinuses, and neck on diagnostic imaging.
- Discuss imaging evaluation of neck masses and deep neck infections.
- Apply diagnostic test selection principles to common dermatologic, ophthalmologic, and otolaryngologic presentations.
The one thing she said outright she would NOT ask. At 1:00:43, on the animal hearing-range figure: “I’m not going to ask you to be like, what is the range of the killer whale … I’m not gonna ask you about that.” It is there to show how wide human hearing is, nothing more.
The one thing she flagged as important on the slide AND out loud. At 23:44, on the necrotizing infection red flag: “You’ll notice I put it in red and it’s bolded … this is important … We think of skin infections like it’s just a skin infection, put them on some antibiotics. No.” Hypotension plus a white cell count of 15,000 or more plus violaceous skin must be screened for necrotizing infection.
She said the melanoma biopsy rule three times in two minutes (18:24–20:35): “You’re not going to perform a shave biopsy. You’re not going to perform a punch biopsy. You are going to perform an excisional biopsy if melanoma is on your differential list as a reasonable concern.” And the reason it matters: “If it is melanoma you will be happy and they will be happy that you’ve done a larger, wider excision.”
Two live additions that are not on any slide. On the potassium hydroxide preparation (13:05): some people pass a flame under the slide a couple of times to help destroy the scale, heating it without boiling it — and if char forms underneath, an alcohol pad cleans it off so the microscope view stays clear. On sampling technique (18:44): the technique itself determines how easily the specimen can be evaluated — a punch that misses an edge produces a sample the pathologist cannot grade.
Visual field localization is deferred. At the visual pathway slide she said the detail is coming “on Thursday”. The four patterns in 3.4 below are still fair game.
3.1 · Objective a — Ask the question first
Most skin disease is diagnosed by history and visual inspection, with office testing added only for uncertain diagnoses. Every test should answer a specific clinical question, and four factors govern which one you pick: cost, availability, invasiveness and diagnostic yield.
| The question | The test |
|---|---|
| Is this an infection? | Potassium hydroxide preparation, or culture |
| Is this a neoplasm, or a rash that will not resolve? | Biopsy |
| Is this an abscess or is it cellulitis? | Point-of-care ultrasound |
In the lecture she put it as “anytime you’re worried about anything that’s a malignancy, tissue is the issue — you need to figure out what the cell line is.” The closing rule of the whole lecture: always choose the least invasive test that answers the clinical question.
3.2 · Objectives a & c — Bedside microscopy and the potassium hydroxide preparation
The three bedside tests are potassium hydroxide, Tzanck and Gram stain. All three are quick, inexpensive, and both sensitive and specific; both limitations are human — operator skill and sampling technique.
| Finding on potassium hydroxide | Means |
|---|---|
| No fungal elements seen | Negative |
| Branching, septate hyphae | Dermatophyte |
| Pseudohyphae WITH budding yeast | Candida |
| “Spaghetti and meatballs” | Tinea versicolor |
Indications: tinea corporis, pedis or cruris; onychomycosis; cutaneous candidiasis; intertrigo. Procedure: scrape with a small scalpel blade onto a glass slide, add one drop of 20% potassium hydroxide, lower the cover glass to exclude bubbles, blot the excess with gauze, then survey at 10× with the condenser lowered to reduce illumination so epithelial cells become visible, and examine anything suspicious at 40×.
Sensitivity depends on adequate scraping, and a clinical-only diagnosis can misidentify a fungal infection — which is the argument for doing the test at all.
Also tested
- Potassium hydroxide preparation. One drop of twenty percent potassium hydroxide is added to the specimen.
- Potassium hydroxide preparation. To make the epithelial cells visible for the low-power examination, reduce the illumination by lowering the condenser.
3.3 · Objectives d & e — Biopsy, the melanoma rule, and soft tissue infection
| Technique | What it gives, and when |
|---|---|
| Shave | Raised epidermal lesions; basal and squamous cell carcinoma; superficial rashes |
| Punch | Full-thickness sample; inflammatory rashes and small lesions |
| Excisional | Removes the entire lesion — preferred for suspected melanoma |
The melanoma rule. A narrow excisional biopsy with 1–3 mm margins, taken to a depth that avoids transecting the base so Breslow depth can be measured. Acceptable excisional methods are fusiform or elliptical, punch, and deep shave or saucerization — all must go below the lesion. A partial or superficial shave is acceptable only when suspicion is low, and it may underestimate Breslow depth; facial, acral and very large lesions are named here too.
Do not confuse these millimeters with the centimeters in CMS I Lecture 9. 1–3 mm is the DIAGNOSTIC biopsy margin that establishes Breslow depth; 0.5–2 cm is the definitive RE-EXCISION margin that follows once the depth is known.
| T category | Breslow depth |
|---|---|
| Tis | Melanoma in situ |
| T1 | 1 mm or less |
| T2 | More than 1 and up to 2 mm |
| T3 | More than 2 and up to 4 mm |
| T4 | More than 4 mm |
Soft tissue infection. Point-of-care ultrasound reliably separates the two: cellulitis shows dermal thickening, increased echogenicity and cobblestoning (which the deck footnotes as non-specific, since venous stasis does it too); an abscess shows a hypoechoic or heterogeneous collection, possibly with debris or septations, and posterior acoustic enhancement. Computed tomography and magnetic resonance are reserved for deep-space infection, necrotizing infection, foreign body and gas, and contrast magnetic resonance best defines the extent of tissue damage.
Also tested
- Limitations of skin biopsy. These are sampling error and the procedural risks of bleeding, scarring and infection.
3.4 · Objective b — Skin and wound cultures
Culture purulent lesions, sampling pus from abscesses, carbuncles and furuncles. Empiric treatment without culture is reasonable in typically presenting, uncomplicated cases. Do not culture an inflamed epidermoid cyst. Consider culturing a non-healing or chronic wound when the patient is immunocompromised, when methicillin-resistant Staphylococcus aureus is suspected, or after treatment failure.
The Levine method. Clean the wound with sterile water or saline, NOT an antimicrobial solution. Identify 1 to 2 cm of clean wound tissue. Rotate the applicator for five seconds with enough pressure to express fluid from the tissue. Do not sample exudate, eschar or necrotic material.
Culture buys you organism identification plus susceptibilities. Its limits: superficial swabs are prone to contamination and colonization and may not correlate with deep infection, so in complex wounds — diabetic foot ulcers, pressure ulcers — a deeper tissue biopsy or aspirate gives higher yield.
3.5 · Objective f — The four ophthalmic tests
The examination runs on VVEEPP: visual acuity, visual fields, external exam, extraocular movements, pupils, pressure.
| Test | Indication | Reading it |
|---|---|---|
| Visual acuity | EVERY eye complaint | Snellen for distance, Rosenbaum for near. Test best-corrected acuity; use a pinhole if reduced. Corrects with pinhole → refractive. Does not correct or worsens → eye pathology. Unilateral loss → optic nerve or ocular; bilateral → systemic or intracranial |
| Visual fields | Assessing the visual pathway | Confrontation at the bedside; formal perimetry or Amsler grid by ophthalmology. Central scotoma → macula or optic nerve. Peripheral loss → glaucoma. Bitemporal hemianopia → chiasmal, think pituitary. Homonymous hemianopia → retrochiasmal, query stroke |
| Fluorescein | Eye pain, foreign-body sensation, trauma, contact-lens wear, red eye | Cobalt-blue light, after a topical anesthetic. Linear → abrasion. Branching or dendritic → herpetic keratitis. Fixed dense staining or opacity → ulcer, urgent referral |
| Tonometry | Glaucoma; acute angle-closure is an ophthalmologic emergency | Normal pressure 10–21 mm Hg. Pressure alone is insufficient — most open-angle glaucoma has normal pressure, and readings vary with corneal thickness |
Optic disc cupping. Normal cup-to-disc ratio is about 0.3; glaucomatous injury gives greater than 0.7. The healthy disc has a small central cup with a robust neuroretinal rim; the glaucomatous disc is enlarged, deeply excavated, with an undermined rim and lamina cribrosa collapse. Excavated, not merely pale, is what distinguishes glaucoma from other optic atrophies.
Ocular hypertension versus glaucoma: raised pressure with no optic damage and normal fields is ocular hypertension, a risk factor. Add optic nerve damage and it is glaucoma.
Also tested
- Tonometry. Its purpose is to measure intraocular pressure and evaluate for glaucoma.
- Pinhole correction. Reduced acuity that corrects with a pinhole points to refraction rather than disease; a refractive error is the likely cause.
- Acuity that does not correct with a pinhole. If acuity does not correct with the pinhole, or worsens, eye pathology is likely; correction points to a refractive error.
- Tonometers for glaucoma screening. Two are used: the Schiotz indentation tonometer and the Goldman applanation tonometer, one indentation and one applanation instrument.
3.6 · Objective g — Throat, hearing and the middle ear
| Rapid streptococcal antigen test | Throat culture | |
|---|---|---|
| Indication | Suspected group A streptococcal pharyngitis with supportive clinical features | Confirming a negative rapid test in children; persistent or severe symptoms |
| Advantage | Fast, point-of-care | Gold standard — highest sensitivity |
| Limitation | Sensitivity only 70–90%, so false negatives | Delayed 24–48 hours |
A negative rapid test in a child should be confirmed by culture; this is not routinely required in adults. And do NOT use antistreptococcal antibody titres to diagnose acute pharyngitis.
Audiometry quantifies the degree and type of hearing loss — conductive versus sensorineural — after abnormal examination findings. Indications: suspected or confirmed loss, persistent otitis media with effusion, and asymmetric loss, to screen for retrocochlear pathology. An air–bone gap of 10 dB or more correlates with middle-ear fluid; a primary-care fail is more than 20 dB hearing level at one or more frequencies.
Screening presents tones at the upper limits of normal hearing — 25–30 dB for adults, 15–20 dB for children. A threshold search finds the softest sound heard at each frequency 50% of the time. On the audiogram, intensity is on the vertical axis, right ear is a red circle and left ear a blue cross. Bone conduction uses a device vibrating through the forehead or mastoid. In the lecture she added the clinical shape of it: we lose the high frequencies first, which is the pattern of presbycusis and sensorineural loss.
Tympanometry varies air pressure in the external canal while measuring reflected energy from a tone — the less compliant the system, the greater the intensity reflected back. Pressure runs along the horizontal axis and compliance the vertical, with a normal peak at 50 mm H2O.
| Type | Meaning |
|---|---|
| A | Normal middle ear function — and also typical of sensorineural loss with a normal middle ear |
| B (flat) | Restricted mobility. Flat + HIGH canal volume → perforation or patent tube. Flat + NORMAL volume → middle-ear effusion. |
| C | Significant negative middle-ear pressure — eustachian tube dysfunction. Significant for treatment below −200 mm H2O |
| AS | Normal pressure, reduced mobility — S for stiff or shallow. Ossicular chain fixation, tympanosclerosis |
| AD | Normal pressure, hypermobility — flaccid membrane from disarticulation |
Also tested
- Screening pure tone audiometry. Tones are presented at 25 to 30 decibels for adults and 15 to 20 decibels for children, the upper limits of normal hearing, set lower for children.
- Rapid streptococcal antigen test sensitivity. Sensitivity is about seventy to ninety percent, which can lead to false negatives, so a negative result may need confirming.
- Significant negative middle-ear pressure. A type C curve shows normal mobility with negative pressure. That pressure is significant for treatment when more negative than minus two hundred millimeters of water.
- Throat culture limitation. Results are delayed, taking twenty-four to forty-eight hours, the trade-off against the rapid antigen test's speed.
- Failing primary-care conventional audiometry. A fail is more than twenty decibels hearing level at one or more frequencies.
- Audiogram and pure tone audiometry. Sound intensity is recorded on the audiogram's vertical axis, and pure tone audiometry requires a quiet environment.
- Indications for tympanometry. The three are suspected effusion, otitis media with effusion, and eustachian tube dysfunction.
3.7 · Objectives h–l — Head and neck imaging, and putting it together
| Computed tomography (with contrast) | Magnetic resonance imaging |
|---|---|
| First-line for most acute head and neck infections. Fast, widely available; shows abscess, edema, gas, bone erosion. Strengths: calcification and bone, sinuses, acute trauma and orbital fractures, foreign bodies, and the unstable or claustrophobic patient. Think CT for bone, trauma and speed. |
Superior soft-tissue contrast, no ionizing radiation. Strengths: intracranial or orbital extension, perineural spread, skull base, tumors. Think MRI for soft tissue, nerves, and tumor or intracranial extension. |
| Presentation | Study |
|---|---|
| Uncomplicated acute rhinosinusitis, otitis, simple soft-tissue infection | No imaging |
| Facial swelling, proptosis, eye signs or neuro signs; complicated sinusitis or orbital cellulitis | Emergency contrast CT of sinuses and orbits |
| Deep neck infection | Contrast CT neck — ultrasound is not helpful here |
| Neck mass | Ultrasound first — superficial or cystic versus solid, size, vascularity |
| Deep or malignant lesions | CT or MRI for staging |
| Acoustic neuroma, asymmetric sensorineural loss | MRI with contrast |
| CT sinus | CT orbit | CT neck |
|---|---|---|
| Mucosal thickening Air-fluid levels Sinus opacification |
Orbital cellulitis with fat stranding Abscess Blowout fracture Herniated orbital contents |
Abscess as a rim-enhancing fluid collection Enlarged or necrotic lymph nodes |
Blow-out fracture: air in the orbit (orbital emphysema), a fracture of the orbital floor, and soft tissue extending down into the top of the maxillary sinus. Tripod fracture: diastasis of the frontozygomatic suture, a fracture of the orbital floor with orbital emphysema, and a fracture through the lateral wall of the maxillary sinus, which fills with blood.
Deep neck infection. Contrast CT of the neck asks three questions: is there a drainable abscess, is the airway compromised, and is it spreading towards the mediastinum. Magnetic resonance adds value for intracranial extension, vascular thrombosis (Lemierre) and osteomyelitis. Her framing in the lecture, off her own peritonsillar abscess story: “if you were worried about a deep neck infection, you want to know about abscess, you want to know about airway, and you want to know about spread.”
The four questions to ask about any test: what does it evaluate well, when do we order it, what are its strengths and limitations, and how do the results confirm the condition. She added a fifth in the lecture: “what is our next step if it doesn’t tell us?” — and only then do cost, availability and urgency enter.
Also tested
- Thrombotic microangiopathy. Low platelets plus a hemolytic anemia with schistocytes indicate consumption inside small vessels, where red cells are sheared as they pass. Fever and confusion complete the classic pentad.
- Teardrop red cells. They form when red cells squeeze out of a marrow packed with scar tissue or tumor. With cytopenias in all three lines and splenomegaly, the mechanism is marrow infiltration and replacement.
- Normal blood count panel. When every value sits inside its range, report it as normal with no further testing. A reference range is the mean plus or minus two standard deviations, so chasing values merely near an edge generates work rather than answers.
- Sinus infection on computed tomography. The three findings are mucosal thickening, air-fluid levels and sinus opacification.
- Neck computed tomography. It shows abscess as a rim-enhancing fluid collection, and enlarged or necrotic lymph nodes.
- Orbital computed tomography. It shows orbital cellulitis with fat stranding, abscess, blowout fracture and herniated orbital contents.
- Aplastic anemia. All three blood cell lines down (pancytopenia) with a low reticulocyte count means the marrow is not producing anything; pancytopenia with an absent reticulocyte response defines marrow failure, as in aplastic anemia.
- Polycythemia vera. When all three blood cell lines are raised, it points to a clonal marrow disorder such as polycythemia vera rather than a response to anything; a secondary cause drives red cells alone and has no reason to raise white cells and platelets too.
- Myeloproliferative disorder. A white count near 100,000 with granulocytes at every stage of maturation and a massive spleen is clonal overproduction, not a response to infection, and indicates a myeloproliferative disorder; raised platelets and mild anemia fit the same process.
4 · Complete Blood Count and Hematology Diagnostics
Instructional Objectives
Topic Outline 4: Complete Blood Count and Hematology Diagnostics
- Explain the components of a complete blood count.
- Explain the difference between hemoglobin and hematocrit.
- Discuss red blood cell indices.
- Calculate absolute white blood cell counts.
- Discuss the clinical significance of abnormalities in: i. Red blood cells · ii. White blood cells · iii. Platelets
- Discuss indications for ordering a complete blood count.
- Compare and contrast laboratory patterns associated with: i. Microcytic anemia · ii. Normocytic anemia · iii. Macrocytic anemia
- Compare and contrast laboratory tests used in the evaluation of anemia
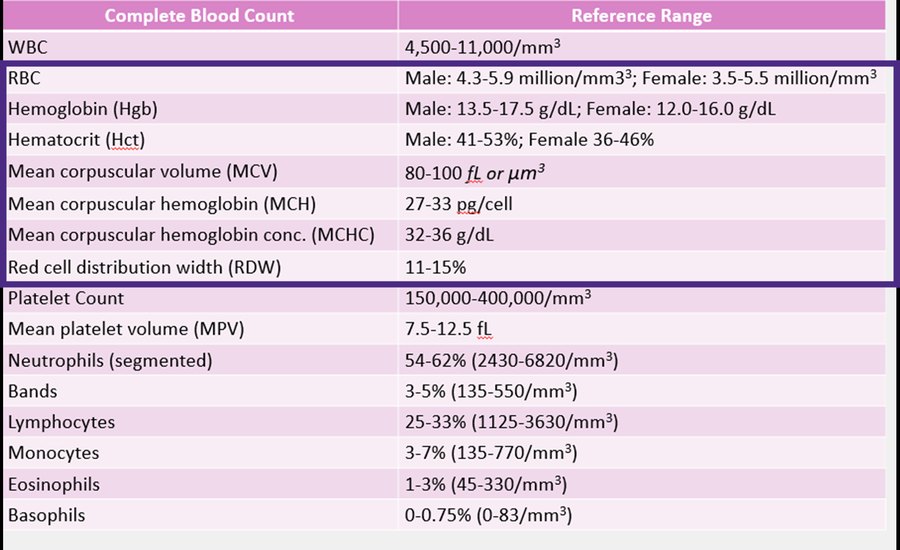
This deck gives three of its reference ranges two different ways. The full reference table (a picture, on slides 7 and 31) does not agree with the individual teaching slides:
| Reference table (slides 7, 31) | Teaching slide | |
|---|---|---|
| Lymphocytes | 25–33% | 24–44% (slide 26) |
| Platelets | 150,000–400,000 | 150,000–450,000 (slide 30) |
| Red cell distribution width | 11–15% | 12–15% (slide 56) |
A fourth set appears on the labeled smear on slide 15 (neutrophil 60–70%, lymphocyte 20–25%, monocyte 3–8%, eosinophil 2–4%, basophil 0.5–1%), which is a borrowed textbook graphic and matches neither. No quiz question is built on a disputed value. Everything else — white cells, hemoglobin, hematocrit, all four indices, mean platelet volume, neutrophils, eosinophils, monocytes — agrees across both and is fair game.
The worked example on slide 21 is mis-bracketed. It prints ANC = 6,000 × (40 + 5/100) = 2,700. That bracketing evaluates to 240,300. The printed answer of 2,700 is correct and matches the formula image on slide 20, so it is a typographical slip rather than a teaching error. Use ANC = WBC × (%neutrophils + %bands) ÷ 100.
The reference ranges are meant to be approximate. This is the thing the recording changes most. The three ranges that differ between the deck's reference table and its teaching slides are not a mistake to be resolved — she teaches them as lab-dependent on purpose. On neutrophils: “54 to 62 plus or minus a few, depending on what lab you're in … I've probably seen so many different ranges throughout, and it doesn’t matter what the range is, it just matters what the range is for where you’re working.” Learn the approximate figure and the direction of abnormality, not the decimal.
The one range she says does NOT vary is the platelet count. She used 150,000–450,000 — the teaching-slide figure — and added “this one I have not seen be very different from lab to lab. This one’s been pretty consistently the same.”
The absolute neutrophil count calculation is explicitly required. Apps and the electronic record will do it for you, “however, everyone needs to know how to calculate that.” There are two formulas, and which you use depends only on whether the white cell count is written in whole numbers or in thousands.
The neutropenia table only applies below 1,500. Asked directly whether the worked example's answer of 2,700 could be graded on it, she said the “chart is only for those individuals who have an [absolute neutrophil count] of less than 1500. Because we know that the 2700 is more than 1500, we know that the patient is not neutropenic.” Nothing on the slide says that. Calculate first, then decide whether the table applies at all.
She drew a line around the anemia algorithm — twice. On the microcytic arm: “for now, I’m happy if you understand genetic versus non-genetic; the rest of the stuff will come later.” On the normocytic arm: “all of this will come [with heme] — if you can just focus on this first part here, that will be beneficial for you.” The full algorithm stays below because it is on the slides, but that is where she put the emphasis.
Two practical habits she offered. Read hemoglobin, multiply by three, and check the hematocrit lands in the same vicinity. And on ordering: the first time you meet a patient and work them up, order with differential; afterwards, for monitoring a known problem, without is enough. Her one-liner on the panel itself: “if we don’t know what to order, start with a CBC.”
4.1 · Objectives a & f — What is on the panel, and which one to order
A complete blood count reports on the hematologic system and other organ systems. It contains the red cell count, hemoglobin, hematocrit, blood smear, platelet count and mean platelet volume; the four red cell indices (mean corpuscular volume, mean corpuscular hemoglobin, mean corpuscular hemoglobin concentration, red cell distribution width); and the white cell count with differential.
| Without differential | With differential |
|---|---|
| Red cell count · red cell indices · total white cell count · platelets Order it to screen or monitor for anemia, overall leukocytosis or leukopenia, or thrombocytopenia |
Everything above plus neutrophils, lymphocytes, monocytes, eosinophils, basophils Order it when the specific white cell line matters — bacterial infection (neutrophils), viral (lymphocytes), allergy or parasites (eosinophils), hematologic malignancy, autoimmune or inflammatory disease |
The deck's warning is practical: know which one you are clicking, because the two give different values.
Also tested
- Complete blood count with differential. The version with differential adds the breakdown of white cell types to everything the version without it contains; one is a strict superset of the other.
4.2 · Objective e(ii) — The white cell lines
Normal white cell count is 4,500–11,000 cells/µL. Below is leukopenia, above is leukocytosis. White cells fight infection, migrate to injury by chemotaxis, phagocytose foreign organisms, and produce and distribute antibodies.
| Line | Normal | Appearance | Raised by | Lowered by |
|---|---|---|---|---|
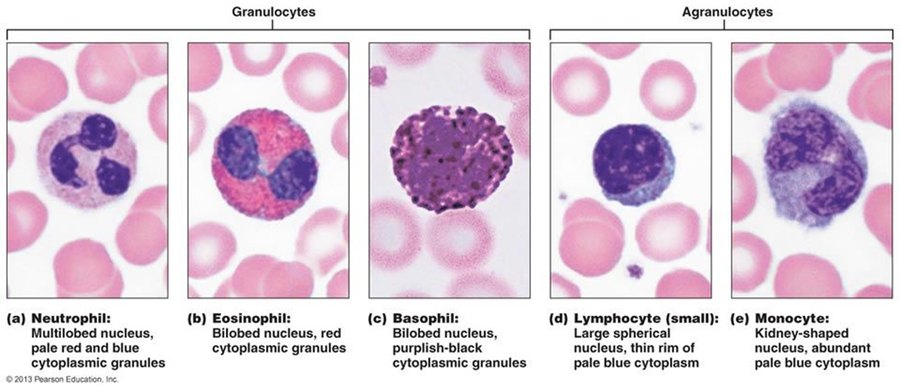
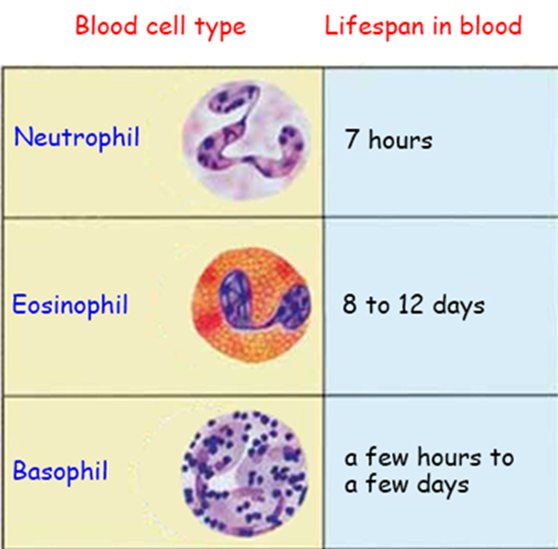
| Neutrophil most abundant | 54–62% | 3–4 lobed nucleus, granular cytoplasm | Bacterial infection, myocardial infarction, burns, steroids, rheumatoid arthritis, pregnancy/labor/surgery | Marrow damage, folate and B12 deficiency, radiation, toxic chemicals (benzene), overwhelming infection, viral infection |
| Bands immature neutrophils | ≤5% | 1–2 lobes separated by a thick chromatin band | Neutrophils + bands = bacterial infection. A left shift is an increase in immature cells — neutrophils are consumed faster than the marrow can mature replacements | |
| Eosinophil | 1–3% | Two-lobed nucleus, granules with histamines | Parasitic infection, allergy, cancer | Marrow suppression |
| Basophil | <1% | Usually two-lobed, granules with heparin, histamine, inflammatory mediators | Allergy, cancer | Marrow suppression |
| Monocyte largest | 3–7% | No granules; kidney-shaped nucleus | Chronic inflammation, stress, viral infection | Marrow injury |
| Lymphocyte | see the warning box | Small, mononuclear, no granules | Viral infection | Human immunodeficiency virus, marrow suppression |
Steroids raise the neutrophil count by demargination — the deck spells out the mechanism: they cause neutrophils to detach from the blood vessel wall and enter the main bloodstream. And folate and B12 lower it because both are needed for the marrow to function.
Granulocytes (neutrophil, eosinophil, basophil) have distinctive cytoplasmic granules holding enzymes, proteins and toxic substances. Agranulocytes (monocyte, lymphocyte) have none, and a non-lobular nucleus. Monocytes differentiate into macrophages or dendritic cells — Kupffer cells in the liver, alveolar macrophages in the lung, Langerhans cells in the skin. Lymphocytes are T cells, B cells and natural killer cells, and the complete blood count does not tell them apart.
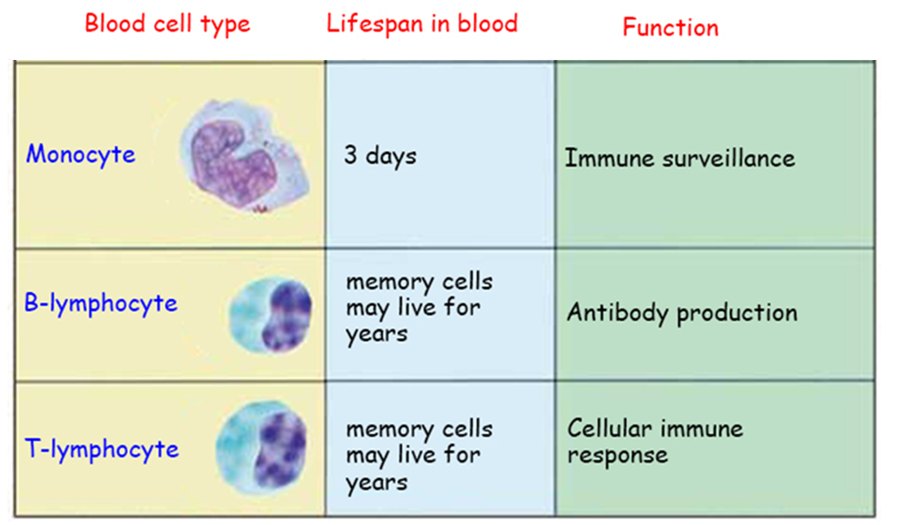
Also tested
- Absolute neutrophil count. It equals the white cell count times the neutrophil percentage divided by 100. A count of 2,000 per microliter with 20% neutrophils gives 400 per microliter, and below 500 per microliter is severe neutropenia.
- Neutrophil role. The neutrophil, the most abundant white blood cell, is the body's main defense against bacteria and its primary defense against microbial invasion, acting by phagocytosis.
- Reasons to check a white cell count. Non-specific constitutional symptoms that warrant it are unexplained fatigue, weakness, unexplained bruising or bleeding, and weight loss.
- Eosinophilia. Eosinophils are the white cell line raised by parasites, allergy and, less often, malignancy. A marked rise (18% against a range of 1 to 3) points to a parasitic infestation or an allergic process.
- Eosinophil. It makes up one to three percent of white cells, has a two-lobed nucleus, and carries granules containing histamines.
- Lymphocyte changes. Lymphocytes are increased by viral infections and decreased by human immunodeficiency virus and bone marrow suppression; a virus appears on both sides.
- White blood cell range. Normal is 4,500 to 11,000 cells per microliter, with leukopenia below 4,500 and leukocytosis above 11,000.
- Monocyte changes. Monocytes are increased by chronic inflammation, stress and viral infection, and decreased by bone marrow injury.
- Left shift in acute bacterial infection. Neutrophils are increasingly consumed, so more are needed and the marrow releases both mature neutrophils and immature bands to keep up.
- Monocyte normal values. Monocytes make up a normal three to seven percent of white cells; the monocyte is the largest white blood cell and has no granules.
- Bacterial infection on the differential. Neutrophils plus bands indicate it: a raised neutrophil count shows the marrow responding, and immature bands appear when demand has outstripped the supply of mature cells.
- Neutrophil normal values. The normal range is fifty-four to sixty-two percent of the differential, and the neutrophil is the most abundant white blood cell.
- Immune thrombocytopenic purpura. It is an ISOLATED thrombocytopenia, with red cells and white cells untouched and a normal smear, after a viral illness; the absence of schistocytes separates it from the microangiopathies.
- Lymphocytosis with atypical lymphocytes. A lymphocyte-predominant leukocytosis with atypical lymphocytes on the smear is the pattern of a viral infection; with pharyngitis it points strongly to infectious mononucleosis.
4.3 · Objective d — Absolute counts, and grading neutropenia
A percentage means nothing without the total. The general form is absolute count = total white cell count × that type's percentage ÷ 100, and it works for every line. For neutrophils there is one twist: bands count WITH the neutrophils.

Worked example (the deck's own): a white cell count of 6,000/µL with 40% neutrophils and 5% bands gives 6,000 × (40 + 5) ÷ 100 = 2,700/µL. When the count is written in thousands, the equivalent form is 10 × WBC(thousands) × (%neutrophils + %bands).
The number only means something once you can place it in a band — which is what the next figure is for, and it is nowhere in the slide text.
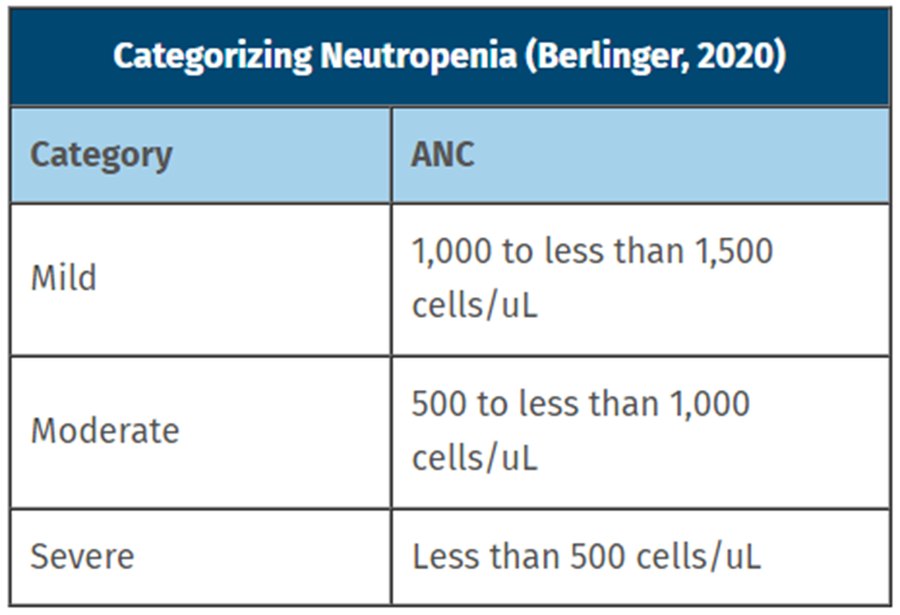
Also tested
- Absolute neutrophil count. Bands count with the neutrophils: white blood cell count × (neutrophil percent + band percent) ÷ 100, so 1,200 × (22 + 6) ÷ 100 = 336 per microliter. Below 500 is severe neutropenia, the threshold that changes precautions and antibiotic decisions.
4.4 · Objective e(iii) — Platelets
Platelets form in the bone marrow from megakaryocytes, which break into fragments — so they are not really cells. Lifespan 7–10 days. Primary role is hemostasis, defined by the deck as stopping the bleeding and repairing damaged vessels; they also contribute to coagulation, vascular integrity, inflammation, immune defense, wound healing and thrombosis.
| Raised by | Lowered by | |
|---|---|---|
| Platelet count | Trauma, acute hemorrhage, iron deficiency, polycythemia vera | Marrow suppression — chemotherapy, alcohol, radiation, aplastic anemia, drugs |
| Mean platelet volume 7.5–12.5 fL |
An increase in immature platelets, as after recent blood loss | Bone marrow failure |
Risk of hemorrhage increases below 20,000. Note the oddity worth holding: iron deficiency raises platelets while lowering red cells.
Also tested
- Platelet count and hemorrhage. The risk of hemorrhage increases when the platelet count falls below 20,000, against a normal count of 150,000 to 450,000 per microliter.
- Raised platelets in iron deficiency. The rise is reactive; iron deficiency is one of the causes of a raised platelet count, alongside trauma, acute hemorrhage and polycythemia vera. It needs no separate workup, and treating the iron deficiency settles it.
4.5 · Objectives b & c — Hemoglobin, hematocrit and the four indices
Hemoglobin is the amount of hemoglobin in a volume of blood. Hematocrit is the percentage of that blood which is red cells — packed cell volume. The rule of thumb: hemoglobin × 3 = hematocrit.
All three of red cell count, hemoglobin and hematocrit are raised by the same three things — polycythemia vera, chronic hypoxia (chronic obstructive pulmonary disease, sleep apnea, high altitude) and dehydration — and lowered by blood loss, nutritional deficiency, marrow disorders, chronic kidney disease, cancer and dilution. Hematocrit adds smoking and hypoventilation to the raised list, and hemolysis to the lowered one.
The deck is careful about one thing: the red cell COUNT does not accurately measure oxygen carrying capacity and is not directly used to diagnose anemia, though it is still used in evaluating it.
| Index | What it is | Normal | Formula |
|---|---|---|---|
| MCV | Average red cell volume — measured | 80–100 fL | Hct(%) × 10 ÷ RBC (million/µL) |
| MCH | Average hemoglobin in a single cell — calculated | 27–33 pg/cell | Hgb(g/dL) × 10 ÷ RBC (million/µL) |
| MCHC | Average hemoglobin concentration in packed cells — calculated | 32–36 g/dL | Hgb(g/dL) × 100 ÷ Hct(%) |
| RDW | Degree of anisocytosis, the variation in size | see the warning box | — |
MCH and MCHC differ only in their denominator — the red cell count versus the hematocrit — and that is the whole difference between “per cell” and “per volume”. MCHC is the automated screening flag for hereditary spherocytosis and other hyperchromic or dehydrated red cell states.
Hypochromic cells have central pallor greater than one third of the cell diameter (MCH <27, MCHC <32); normochromic is exactly one third; hyperchromic is a deeper red with MCH >33 and MCHC >36, seen in spherocytes.
Also tested
- Macrocytosis. It is defined by a mean corpuscular volume greater than one hundred femtoliters, and is caused by vitamin B12 or folate deficiency.
- Hemoglobin and hematocrit pairing. The hematocrit should be roughly three times the hemoglobin (9 predicts about 27). A pair far apart, such as 9.0 with 48%, suggests a sampling or analyzer problem worth repeating.
- Microcytic, hypochromic cells. A mean corpuscular volume below range makes cells small, and low mean corpuscular hemoglobin and concentration make them pale, with central pallor exceeding a third of the diameter. Iron deficiency and thalassemia sit here.
- Decreased hematocrit. The four causes are anemias, acute or chronic blood loss, hemolysis and dilution.
- Microcytosis. It is defined by a mean corpuscular volume of less than eighty femtoliters, as seen in iron deficiency anemia or thalassemia.
- Red cell index formulas. Mean corpuscular hemoglobin is hemoglobin times ten over the red cell count; mean corpuscular hemoglobin concentration is hemoglobin times one hundred over hematocrit, and the denominator tells them apart.
- Red cell shape terminology. Poikilocytosis means abnormally shaped red blood cells; it is the umbrella term for the shape variants.
- Beta thalassemia trait. Markedly microcytic anemia with normal iron stores and a red cell count that is high rather than low indicates beta thalassemia trait: the marrow makes plenty of small cells. Iron deficiency cannot produce that combination.
4.6 · Objective e(i) — Red cell morphology
The deck sorts morphology four ways: size, hemoglobin distribution, shape variation (poikilocytosis) and inclusions with cell distribution. Start with size, because that is also where the anemia algorithm starts.
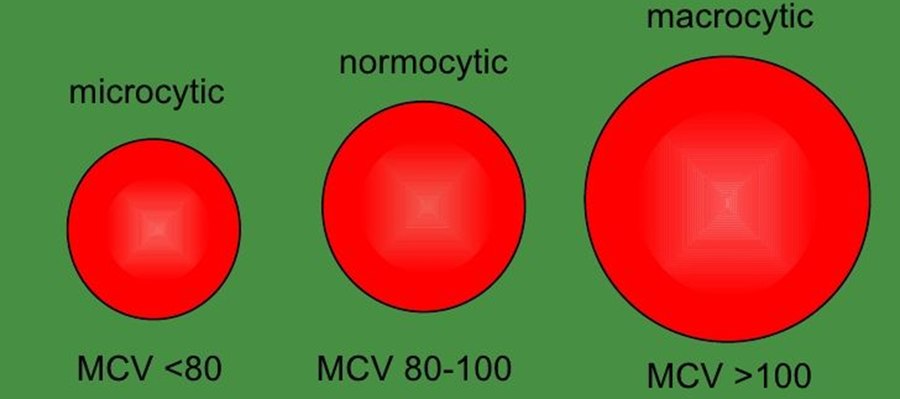
The two spiky cells are the pair people confuse, so learn them against each other.
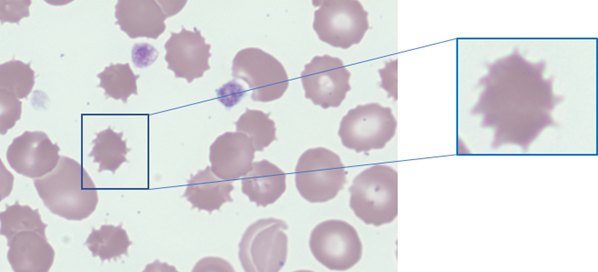
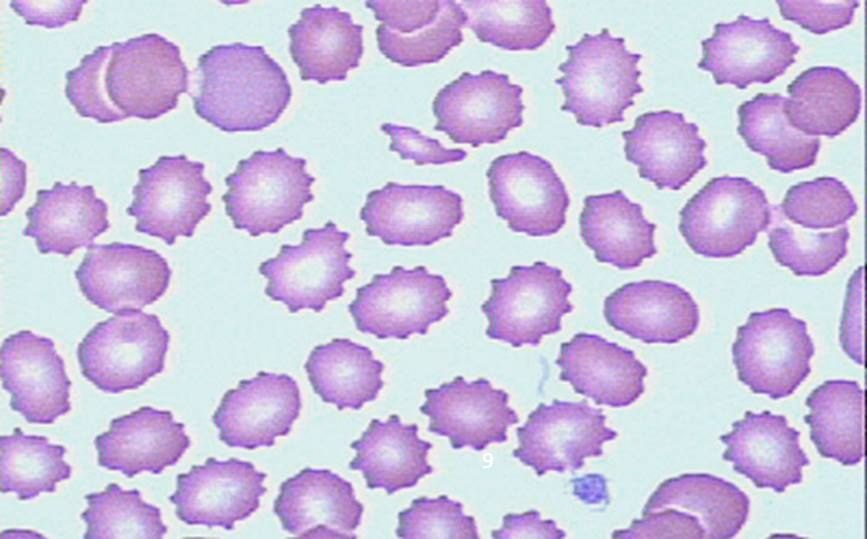
Acanthocyte: irregular spikes, no central pallor, liver disease — from abnormal lipid metabolism or membrane change. Echinocyte: regularly spaced blunter projections right around the cell, central pallor preserved, renal disease.
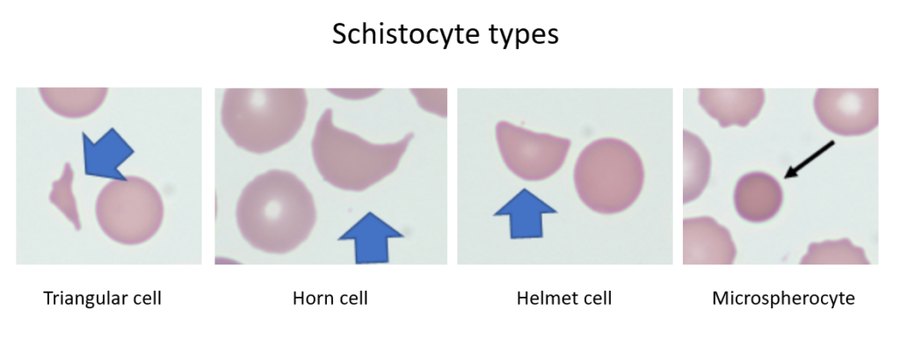
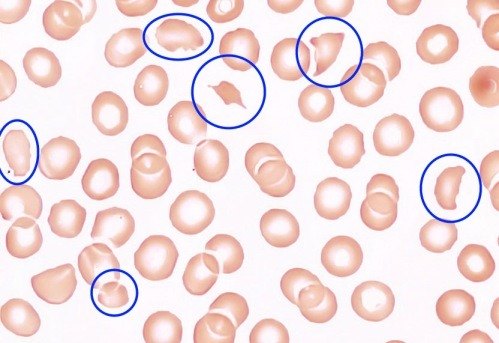
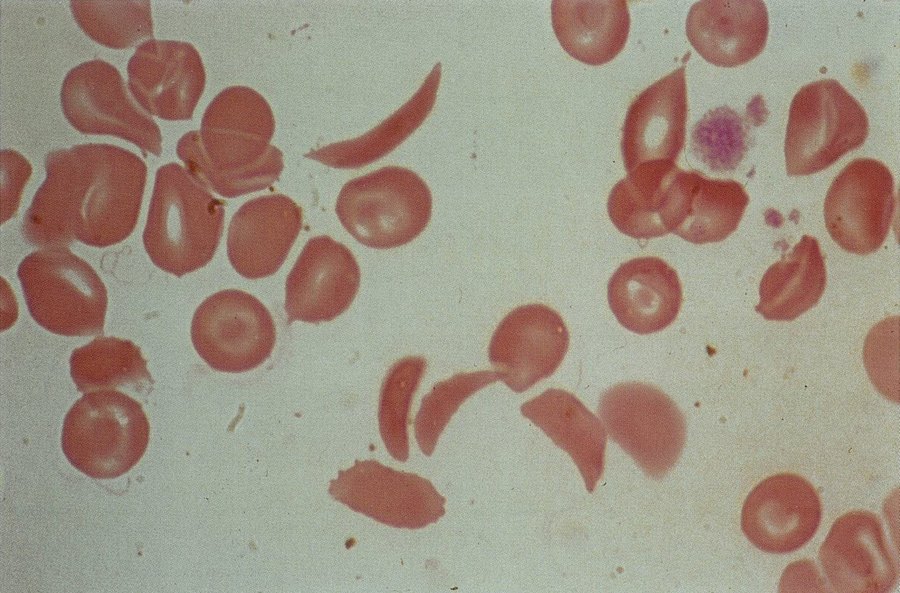
Schistocytes are fragments — helmet, horn, triangular and microspherocyte forms — usually microcytic and lacking central pallor. Hemolysis, mechanical trauma (mechanical heart valves), medications (cyclosporine). Automated counters may count them as platelets, which can make a platelet count look falsely reassuring. Sickled cells (drepanocytes) are thin crescents with no central pallor and dense hemoglobin, formed under low oxygen tension.
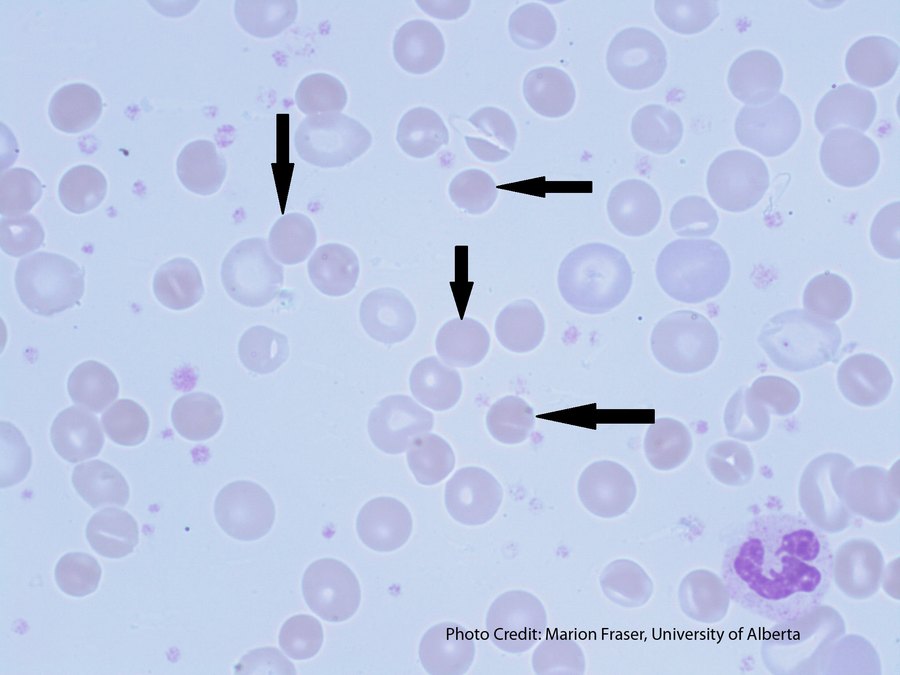
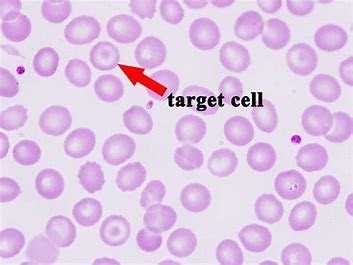
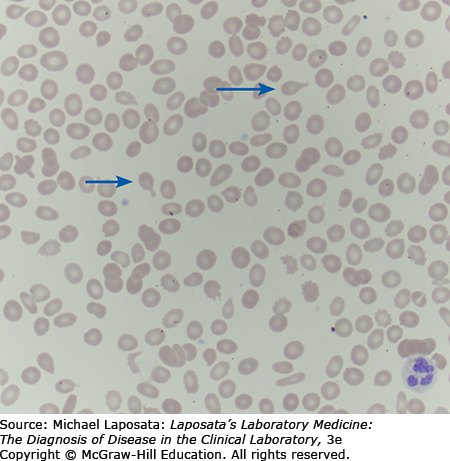
Spherocyte: perfectly round, central pallor lost, often smaller than normal — hereditary spherocytosis. Target cell (codocyte): a dark circle inside the central pallor, from redundant cell membrane — post splenectomy and liver disease. Teardrop cell (dacrocyte): formed in marrow infiltrated by scar tissue or tumor — bone marrow disease.
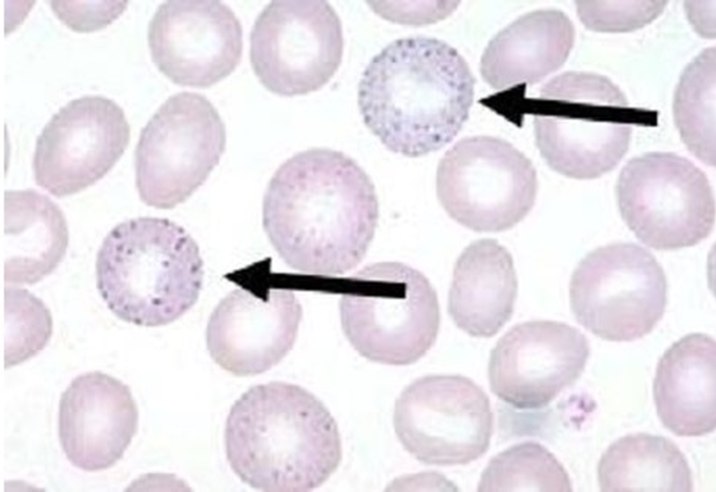
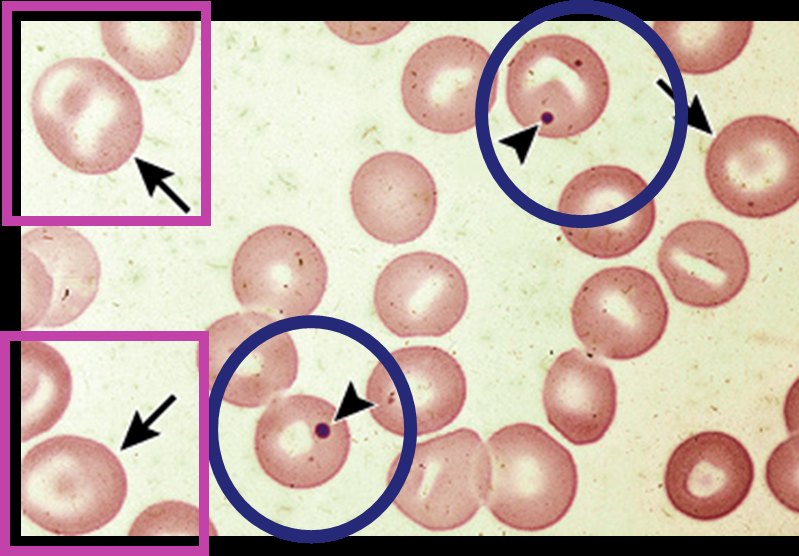
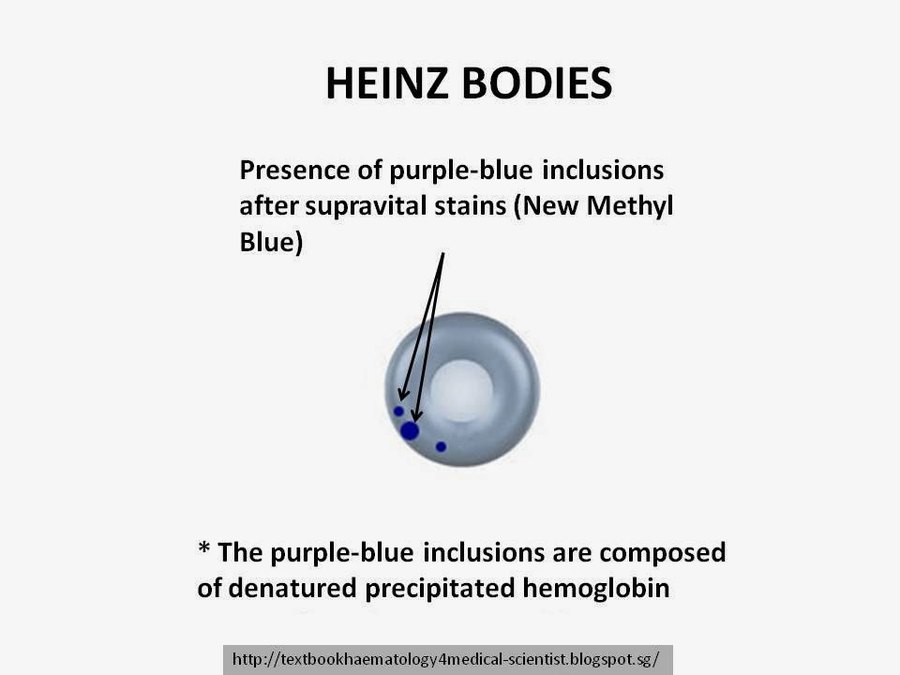
Basophilic stippling is ribosomal RNA in blue-black dots spread evenly through the cytoplasm — lead poisoning. A Howell-Jolly body is a single dark purple residual nuclear fragment; the spleen normally removes them, so finding one means splenic dysfunction or asplenia — which is why target cells turn up in the same field.
Heinz bodies are the easiest thing in this lecture to miss. Denatured hemoglobin at the cell periphery, in G6PD deficiency — and they require a supravital stain (new methylene blue). They are invisible on the routine Wright stain used for the rest of the differential, so nobody will report them unless you ask.
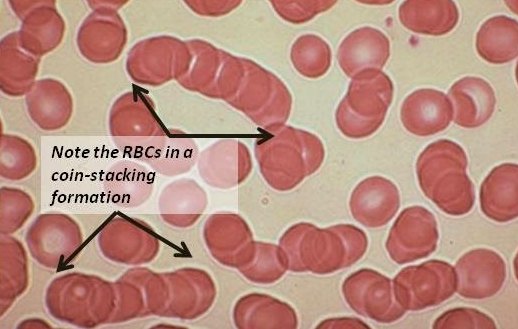
Rouleaux is stacking like rows of coins, because raised serum proteins neutralize the negative surface charge that normally keeps red cells apart — multiple myeloma, liver disease. Agglutination is disorderly clumping from antibodies bridging the cells — transfusion reactions. Different pattern, different mechanism, different diagnosis.
Also tested
- G6PD. Glucose-6-phosphate dehydrogenase is an enzyme that protects red cells from harmful substances. Deficiency arises when the gene driving the enzyme mutates.
- Target cells. Liver disease adds redundant membrane to the red cells, giving a bullseye from too much membrane for the volume of hemoglobin; liver disease and splenectomy are the two classic causes, and the macrocytosis is non-megaloblastic.
- Target cells after splenectomy. Splenectomy increases target cells because of altered filtration dynamics; the spleen normally remodels the membrane as cells pass through.
4.7 · Objectives g & h — Working up an anemia
Four steps, and the notes say to do them simultaneously: assess the clinical presentation; check the complete blood count and chemistry panel; determine the mean corpuscular volume; check the reticulocyte count. Look at the peripheral smear if you can get one. A decreased reticulocyte count means underproduction; an increased one suggests hemolysis or blood loss — and the count is most useful when it is very high or very low.
| Microcytic <80 fL | Normocytic 80–100 fL | Macrocytic >100 fL |
|---|---|---|
| Iron deficiency (most common cause of anemia — evaluate for occult blood loss, often the first sign of gastrointestinal bleeding) Lead poisoning Anemia of chronic disease Thalassemia Sideroblastic anemia |
Hypo-proliferative: aplastic anemia, anemia of chronic disease, marrow infiltration by tumor, hypometabolic states Hemolysis or hemorrhage: acute blood loss (hemoglobin and hematocrit start to fall within 2–3 days), intrinsic and extrinsic hemolytic anemia, sickle cell anemia |
Megaloblastic: B12, folate, drugs impairing DNA synthesis (methotrexate, antiretrovirals, hydroxyurea), copper deficiency Non-megaloblastic: alcohol, liver disease, hypothyroidism, reticulocytosis, primary marrow disorders, chronic kidney disease |
Intrinsic hemolysis is a defect in the red cell causing premature splenic removal; extrinsic is mechanical stress, immunologic destruction or inflammatory injury from outside. Macroovalocytes and hypersegmented neutrophils are what mark a macrocytic anemia as megaloblastic; without them, think chronic liver disease or acute hematologic malignancy.
| Pattern | Ferritin | Serum iron | Total iron binding capacity |
|---|---|---|---|
| Iron deficiency | ↓ | ↓ | ↑ |
| Anemia of chronic disease | ↑ | ↓ | ↓ |
| Normal all three | → basophilic stippling? Yes → serum lead. No → thalassemia trait | ||
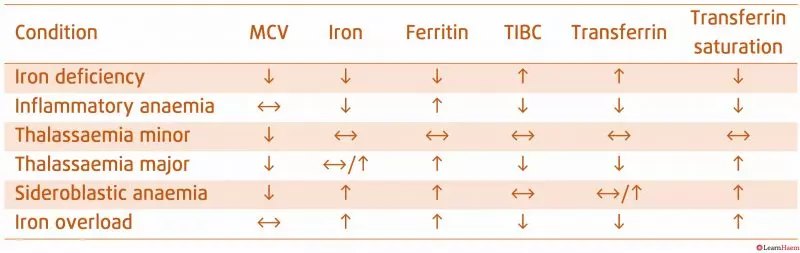
The iron transport analogy on the hand-drawn slide is worth keeping: the bus is transferrin (carries iron), the bus stop is ferritin (stores it, and can be measured because it sits outside the marrow), the home is hemosiderin (storage that cannot be measured), percentage saturation is total iron binding capacity (how many can sit on the bus), and the school is the red blood cell.
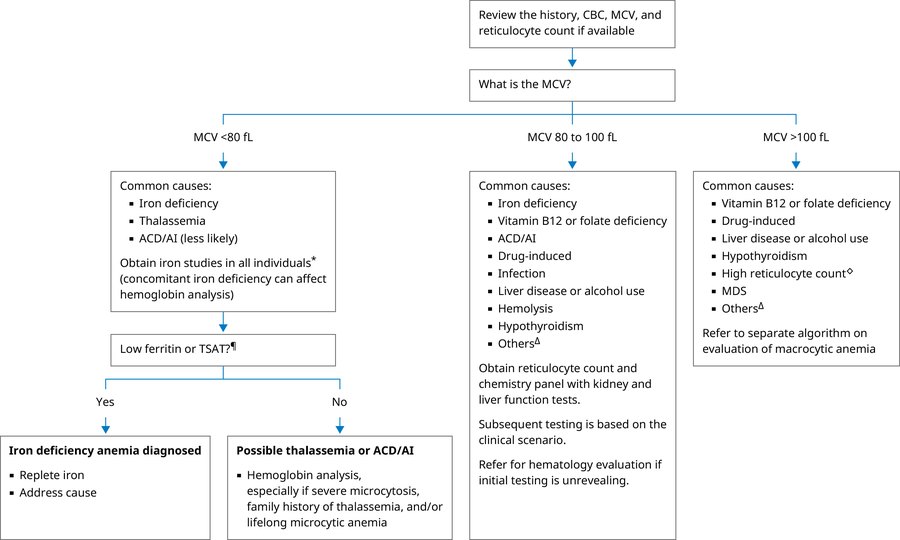
Two things in that algorithm are easy to walk past. Iron deficiency appears in BOTH the microcytic and the normocytic branches, which is why iron studies get obtained even when cell size is normal. And in the microcytic branch you obtain iron studies in all individuals, because a concomitant iron deficiency can affect hemoglobin analysis and hide a thalassemia.
In the normocytic branch, the reticulocyte count splits it three ways: high retics → hemolysis, sickle cell, acute hemorrhage. Low retics with low white cells or platelets → leukemia, metastatic malignancy, aplastic anemia. Low retics with normal or high white cells and platelets → chronic infection or inflammation, malignancy, chronic renal disease, endocrine dysfunction.
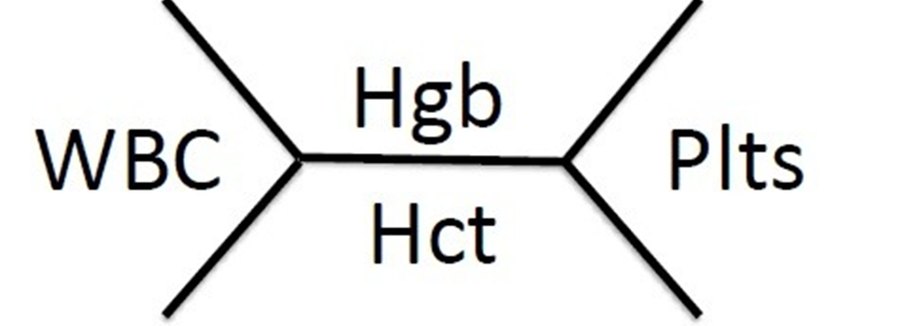
Also tested
- Low hemoglobin. The anemia workup starts at a hemoglobin under 14 grams per deciliter for men and under 12 for women, although the normal male range begins at 13.5.
- Iron comparison table. Thalassemia major and sideroblastic anemia share a low mean corpuscular volume with raised ferritin; sideroblastic anemia also shows raised serum iron.
- Reticulocyte count. It tells whether the bone marrow is functioning appropriately, and it is most helpful when very elevated or very decreased; the middle of the range is the least informative.
- Normocytic branch of the anemia algorithm. Obtain a reticulocyte count and a chemistry panel with kidney and liver function tests, with subsequent testing based on the clinical scenario; hematology referral follows if initial testing is unrevealing.
- Iron deficiency. Transferrin and total iron binding capacity both rise, while transferrin saturation falls: more carrier, less cargo.
- Macrocytosis with normal B12 and folate. With round macrocytes and no macroovalocytes or hypersegmented neutrophils, the problem is not DNA synthesis; non-megaloblastic macrocytosis of liver disease and alcohol is the usual explanation.
- Lead poisoning. It gives a microcytic anemia with NORMAL iron stores, and basophilic stippling, ribosomal RNA scattered evenly through the cytoplasm, is the classic smear association.
- Vitamin B12 deficiency. Macrocytic anemia with a low vitamin B12 and a smear of macroovalocytes and hypersegmented neutrophils (the megaloblastic signature) indicates vitamin B12 deficiency; neuropathy distinguishes it clinically from folate deficiency.
5 · Chemistry Panels, Renal Function and Electrolytes
Instructional Objectives
Topic Outline 5: Chemistry Panels, Renal Function, and Electrolytes
- Explain the components of a chemistry panel.
- Discuss the physiological role of: i. Sodium · ii. Potassium · iii. Chloride · iv. Bicarbonate · v. Glucose · vi. BUN · vii. Creatinine
- Discuss basic liver function studies included in chemistry testing.
- Interpret abnormal chemistry values and their clinical significance.
- Compare and contrast laboratory patterns seen in: i. Renal disorders · ii. Hepatic disorders · iii. Metabolic disorders
- Explain the relationship between electrolyte abnormalities and acid-base disorders.
- Discuss indications for ordering chemistry panels.
- Correlate chemistry findings with other diagnostic modalities when appropriate.
- Explain laboratory evaluation of fluid and electrolyte homeostasis.
What she said about numbers, on 26 August. “The hard and fast memorize these numbers, we don’t do that to you, because it’s gonna depend on the lab, it’s gonna depend on the person, and so we always give you reference ranges.” And again: “There’s not anything I need you to memorize number-wise … but it is helpful for you to kind of have an idea — sodium should be around 140.”
So learn the direction of abnormality and the rough figure. This matters more than usual here, because this deck states three ranges two different ways — see the table below. You are not expected to adjudicate between them.
What she does want calculated: the anion gap. “You really quick and dirty, calculate your anion gap, and our normal range is 8 to 12.” What she does not want calculated: the glomerular filtration rate — “I don’t need you to calculate that or know that just yet, but know of it” — and the corrected sodium, which she does with UpToDate or MedCalc rather than by hand.
5.1 · Objective a — What is on which panel
A chemistry panel is a blood test measuring metabolites, electrolytes and kidney markers, and in its expanded form liver and protein markers as well. It gives a snapshot of chemical balance, metabolism and organ function. Reynolds' framing: a panel is like a group of consultants — you can call on them individually, but you are meant to read them as a whole.
| Panel | Tests | Components |
|---|---|---|
| Basic metabolic panel “chem-7”, “chem-8” | 8 | Glucose, calcium, sodium, potassium, chloride, carbon dioxide (bicarbonate), blood urea nitrogen, creatinine |
| Comprehensive metabolic panel “chem-14” | 14 | All eight of the above plus albumin, total protein, alkaline phosphatase, alanine transaminase, aspartate aminotransferase, bilirubin |
Chem-7 versus chem-8 is calcium — the chem-8 includes it. The comprehensive panel's addition is the liver panel plus total protein and albumin. Order the comprehensive one when you need a fuller picture of liver and nutritional protein status; a basic panel is enough for electrolytes, glucose and renal screening.
Grouped by what they tell you: metabolic fuel — glucose; electrolytes and acid-base — sodium, potassium, chloride, bicarbonate; kidney function and waste — blood urea nitrogen, creatinine; mineral — calcium; liver and protein, comprehensive panel only — albumin, total protein, alkaline phosphatase, alanine transaminase, aspartate aminotransferase, bilirubin.
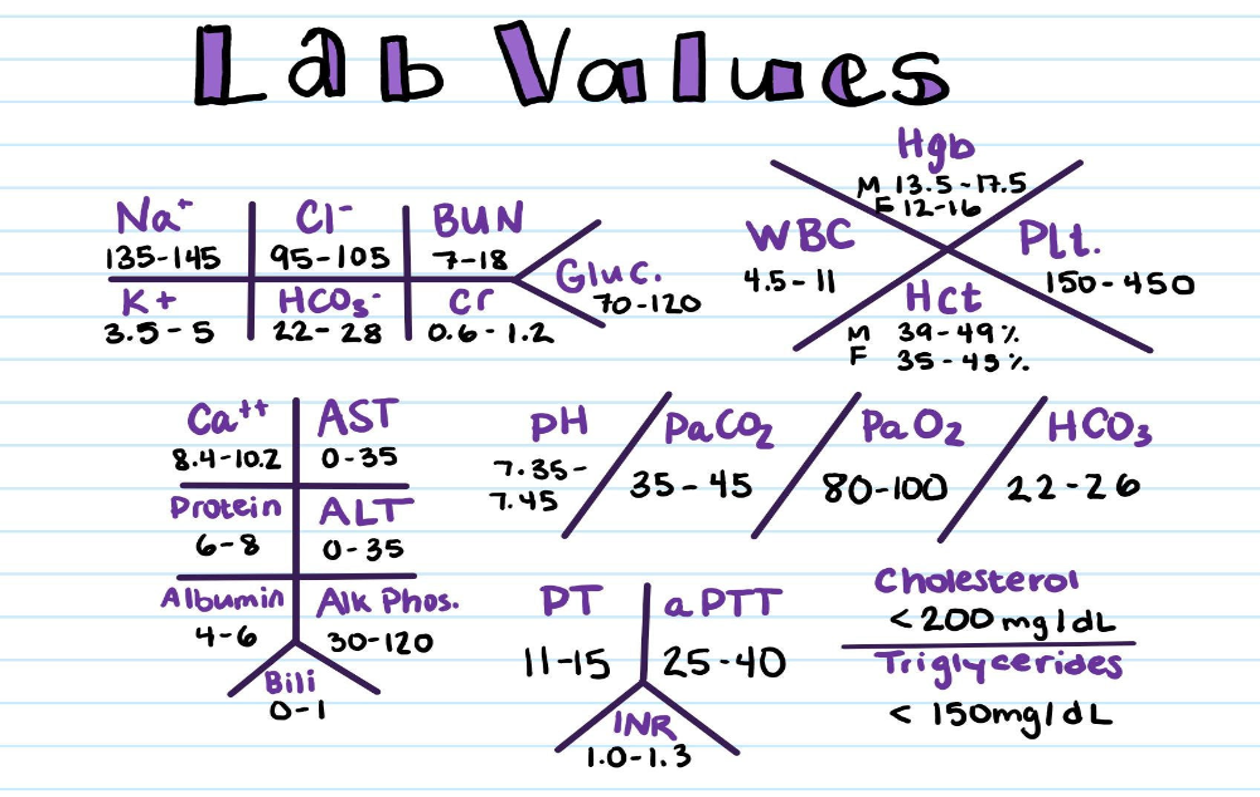
The fishbone is bedside shorthand: position on the diagram identifies the test, so no label is written. Reynolds flagged what it leaves out — “this fishbone also includes the general normal ranges, but what it doesn’t have are the units … depending on where you practice will determine what the units are.”
Two abbreviation traps she called out. On a panel, Cr means creatinine, not chromium, and BUN is blood urea nitrogen, not boron, uranium and nitrogen. She also drew the line on where shorthand belongs: “Do we abbreviate in our electronic notes? Absolutely not. We write out sodium … you’ll literally write out millimeters of mercury.” Shorthand is for handwritten bedside notes and older records.
Also tested
- Calcium on the panel. It sits on its own, as the mineral; glucose is fuel, the four electrolytes cover acid-base, and urea nitrogen and creatinine cover the kidney.
- Alkaline phosphatase on the comprehensive metabolic panel. ALP (alkaline phosphatase) is one of the six liver and protein markers the comprehensive panel adds, and it marks cholestasis or bile duct obstruction.
5.2 · Where this deck disagrees with itself
Three reference ranges appear twice in the deck with different numbers — once on a teaching slide, once on the fishbone picture. Both are shown here rather than picking one, because she supplies ranges on the exam and no question can turn on the difference.
| Analyte | Teaching slide | Fishbone image | Agree? |
|---|---|---|---|
| Bicarbonate | ~22–29 | 22–28 on the panel; 22–26 in the blood-gas column | no |
| Glucose | ~70–99 fasting | 70–120 | no |
| Blood urea nitrogen | ~7–20 | 7–18 | no |
| Creatinine | ~0.6–1.2 | 0.6–1.2 | yes |
Reason to keep in view generally: a normal range is the mean plus or minus two standard deviations, so about 2.5 percent of healthy people fall outside it by chance — and a normal value does not exclude disease. Confirm a borderline abnormality before an extensive workup, and read every value against history, medications and supplements, alcohol and examination.
Also tested
- Intrinsic renal failure. A blood urea nitrogen to creatinine ratio below 20 to 1 places the damage in the kidney itself. High potassium and low bicarbonate are the expected consequences of failing excretion.
5.3 · Objective b(i–iv) — The electrolytes
Sodium is the major extracellular cation and its salts are the major determinant of extracellular osmolality. The serum level is a balance between oral intake and renal excretion. The single most useful idea in this lecture: an abnormal sodium is a water problem first — ask whether there is too much or too little free water before asking about salt. As free body water rises the sodium is diluted; the kidneys compensate by conserving sodium and excreting water. Serum sodium reflects water balance, controlled by thirst and antidiuretic hormone; total-body sodium, via the renin–angiotensin–aldosterone system, governs extracellular volume.
Potassium is the major intracellular cation and the key determinant of membrane electrical potential, especially in neuromuscular tissue. Small serum fluctuations carry large consequences, and both hyperkalemia and hypokalemia can cause life-threatening arrhythmias. It is excreted by the kidneys with no reabsorption, so it must be replaced by diet or supplementation or the level drops rapidly. Regulation is by aldosterone at the distal tubule and collecting duct, plus transcellular shifts driven by insulin, acid-base status and catecholamines — which is why the potassium in diabetic ketoacidosis can mislead.
Chloride is the major extracellular anion and follows sodium to maintain electrical neutrality. Alone it says little; with the other electrolytes it reports acid-base balance and hydration. It is reciprocal with bicarbonate: when carbon dioxide and hydrogen ions rise, bicarbonate moves out of the cell and chloride shifts back in. A low chloride with a high bicarbonate suggests metabolic alkalosis, classically from vomiting; the opposite pairing gives hyperchloremic non-gap acidosis.
Bicarbonate is the primary extracellular buffer and helps transport carbon dioxide. It is reported on the panel as “CO2” — total carbon dioxide, which is mostly serum bicarbonate. Low means metabolic acidosis and is the trigger to calculate the anion gap; high means metabolic alkalosis.
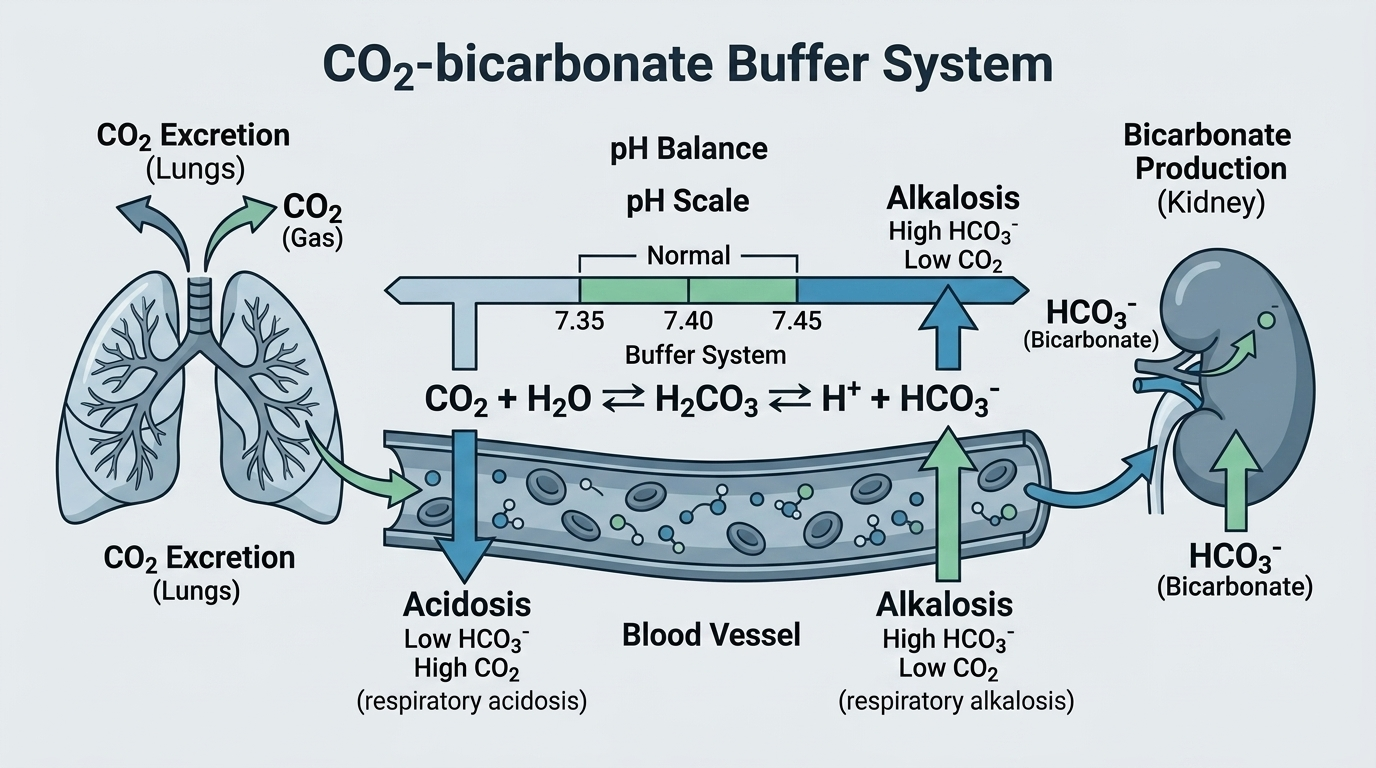
Also tested
- Potassium fluctuations. Small changes in the serum level carry significant physiological consequences. Potassium maintains membrane electrical potential, especially in neuromuscular tissue, so small changes can cause life-threatening arrhythmias.
- Bicarbonate. It is the primary extracellular buffer, maintaining acid-base balance, and it also helps transport carbon dioxide in the bloodstream.
- Potassium in diabetic ketoacidosis. Insulin and acid-base status both shift potassium across the cell membrane, so serum potassium may be raised while total-body potassium is depleted and the serum value can mislead.
- Potassium extremes. Potassium maintains membrane electrical potential, so both hyperkalemia and hypokalemia can cause life-threatening cardiac arrhythmias.
- Sodium. It is the major cation in the extracellular fluid.
5.4 · Objective b(v–vii) — Glucose, urea nitrogen and creatinine
Glucose is the body's main fuel, lowered by insulin and raised by glucagon and the counter-regulatory hormones, with a gluconeogenic contribution from the kidney. Always interpret it against the fasting or non-fasting state. Marked hyperglycemia lowers the measured sodium by dilution and drives osmolality.
Blood urea nitrogen is a nitrogenous waste product of protein metabolism, produced by the liver and cleared by the kidneys. It rises with reduced clearance but is non-specific — dehydration, gastrointestinal bleeding, high protein intake and catabolic states all raise it. Creatinine is a waste product of muscle creatine metabolism, filtered by the kidneys, and more specific. It rises as filtration falls, but is influenced by muscle mass, age and sex, so a normal creatinine can mask a reduced filtration rate in an elderly or cachectic patient.
Read the two together. A ratio above 20 to 1 suggests a prerenal cause; below that points to intrinsic renal disease. The estimated filtration rate is derived from creatinine — know of it, and do not calculate it.
Also tested
- Reading blood urea nitrogen. Interpret it alongside creatinine, not alone. Urea nitrogen alone cannot distinguish dehydration or a protein load from kidney failure; the ratio to creatinine separates them.
- Creatinine interpretation. Creatinine comes from muscle metabolism, so an elderly or cachectic patient with little muscle generates less and may have a normal-looking value that conceals reduced filtration.
- Glucose regulation beyond the pancreas. Glucose is balanced by insulin and by glucagon and the counter-regulatory hormones, and the kidney also contributes through gluconeogenesis.
5.5 · Objective c — The liver studies
The asterisk on her slide title is the point. Aspartate aminotransferase, alanine transaminase, alkaline phosphatase and bilirubin are markers of liver INJURY, not liver function. They are liver tests, or liver chemistries. The tests that actually measure function are albumin, prothrombin time and bilirubin.
| Test | What it marks | The catch |
|---|---|---|
| Aspartate aminotransferase | Hepatocellular injury | Also in cardiac and skeletal muscle, kidney and brain — less liver-specific |
| Alanine transaminase | Hepatocellular injury | Primarily liver — more specific |
| Alkaline phosphatase | Cholestasis, bile duct obstruction | Also bone, placenta, intestine — confirm hepatic origin with gamma-glutamyl transferase |
| Albumin | Synthetic function | Half-life ~3 weeks, so a low value means chronic disease; may also drop in severe illness |
| Prothrombin time and ratio | Synthetic function | Most sensitive functional marker — can prolong within 24 hours. Factors II, VII, IX, X |
| Total bilirubin | Conjugation and excretion | A breakdown product of red blood cells |
Four patterns of hepatic abnormality:
| Pattern | Definition | Causes |
|---|---|---|
| Hepatocellular | Transaminases raised out of proportion to alkaline phosphatase | Viral hepatitis, fatty liver disease, alcohol, drugs, ischemia |
| Cholestatic | Alkaline phosphatase raised out of proportion to the transaminases | Bile duct obstruction, gallstones, primary biliary cholangitis |
| Mixed | Both raised | — |
| Isolated hyperbilirubinemia | Bilirubin up, enzymes normal | Gilbert syndrome, hemolysis |
Three shortcuts worth having: a ratio of aspartate aminotransferase to alanine transaminase above 2 to 1 suggests alcoholic liver disease; a raised aspartate aminotransferase without a raised alanine transaminase points to cardiac or skeletal muscle rather than liver; and transaminases in the thousands narrow to just three causes — viral, ischemia, toxins. Magnitude bands: mild under 5×, moderate 5–15×, severe over 15× the upper limit.
Also tested
- Cholestatic pattern. Alkaline phosphatase raised far out of proportion to the transaminases is the cholestatic signature, a process obstructing bile flow. A high gamma-glutamyl transferase confirms the alkaline phosphatase is hepatic rather than bone.
- Synthetic function versus injury. Albumin and clotting factors are made by the liver, so a low albumin and prolonged clotting time measure how well it works. Near-normal transaminases show little ongoing hepatocyte injury; function and injury are separate axes.
- Transaminases in the thousands. They have only three causes: viral, ischemic and toxic. With alkaline phosphatase barely moved the pattern is hepatocellular rather than cholestatic, and alanine exceeding aspartate fits acute viral hepatitis.
5.6 · Objectives d & e — Reading a panel, and the three patterns
Work through an abnormal comprehensive panel by organ system, in this order: electrolytes and acid-base (then calculate the anion gap) → renal, with the urea nitrogen to creatinine ratio → glucose → liver → minerals.
| Disorder | Characteristic pattern |
|---|---|
| Renal | ↑ urea nitrogen, ↑ creatinine, ↓ filtration rate; ± ↑ potassium, ↑ phosphate, ↓ calcium, metabolic acidosis; albuminuria |
| Hepatic | ↑ transaminases (hepatocellular) or ↑ alkaline phosphatase and bilirubin (cholestatic); ↓ albumin and ↑ prothrombin time in advanced disease |
| Metabolic (ketoacidosis) | ↑ glucose, ↓ bicarbonate, ↑ anion gap, low pH; ± ↑ potassium despite total-body depletion; corrected sodium |
Two overlaps to know by name: hepatorenal syndrome shows liver and kidney failure together, and diabetic ketoacidosis produces electrolyte and renal derangements at once. Cardiorenal syndrome is the cardiac equivalent.
Also tested
- Abnormal panel values. Any single or combined abnormality usually leads to confirmatory testing, since a single abnormal value is a screening signal rather than a diagnosis.
- Renal pattern. Beyond rising urea nitrogen and creatinine, it adds a raised potassium and phosphate, a lowered calcium, metabolic acidosis and albuminuria.
- Stepwise read of an abnormal comprehensive metabolic panel. Start with the electrolytes and acid-base group (sodium, potassium, chloride, bicarbonate), then calculate the anion gap; then renal, glucose, liver and finally calcium.
- Hypercalcemia of malignancy. A genuinely high calcium with a normal albumin (so not an artifact of protein binding) in someone with a known cancer points to hypercalcemia of malignancy; low phosphate and rising creatinine fit, and confusion and constipation are the classic symptoms.
5.7 · Objective f — Electrolytes and acid-base, and the anion gap
These cannot be separated: they are regulated by the same renal transport mechanisms and physically coupled by electroneutrality.
- Potassium and pH. Acidosis drives potassium out of cells, raising the serum level; alkalosis drives it in, lowering it. Running the other way, potassium depletion increases renal acid secretion.
- Chloride. Losing it, as in vomiting, raises the strong ion difference and produces a metabolic alkalosis.
The anion gap — she does want this one calculated.
Anion gap = sodium − (chloride + bicarbonate) normal 8–12 mEq/L
Extended form, adding potassium: (sodium + potassium) − (chloride + bicarbonate), normal 10–14.
Raised gap → unmeasured acids: methanol, uremia, diabetic ketoacidosis, paraldehyde and propylene glycol, isoniazid and iron, lactic acidosis, ethylene glycol, salicylates. Normal gap → bicarbonate loss from gut or kidney, i.e. hyperchloremic acidosis.
Correct the gap for a low albumin — add about 2.5 for every 1 g/dL the albumin has fallen, because albumin is itself an unmeasured anion.
Also tested
- Anion gap calculation. Sodium minus the sum of chloride and bicarbonate gives the gap. For sodium 138, chloride 104 and bicarbonate 24 milliequivalents per liter it is 10, within the normal range of 8 to 12.
- Normal anion gap. Using the standard formula, which leaves potassium out of the calculation, the normal range is 8 to 12 milliequivalents per liter.
- Potassium and pH. Alkalosis shifts potassium into cells and lowers the serum level, while acidosis shifts it out of cells and raises the serum level.
- Raised anion gap. A wide gap suggests an increase in unmeasured acids, as with lactate, ketoacids or an ingested toxin.
- Anion gap with low albumin. Correct the gap upward by about 2.5 for every one gram per deciliter the albumin has fallen.
- Calculating the anion gap. Gap = sodium − (chloride + bicarbonate); for example 140 − (98 + 12) = 30, against a normal of 8 to 12. A raised gap means unmeasured acids: acid added rather than bicarbonate lost.
- Urine pH in normal anion gap metabolic acidosis. In acidosis the urine should be maximally acidic; a pH of 6.8 suggests renal tubular acidosis, because the kidney is failing to excrete acid (an inappropriately alkaline urine).
- Diabetic ketoacidosis. Findings are high glucose, low bicarbonate and ketones in the urine, with a raised anion gap (normal 8 to 12) because the unmeasured acids are the ketones; deep rapid breathing is respiratory compensation.
5.8 · Objectives g–i — Ordering, correlating, and fluid balance
Order a panel for: screening metabolic, liver and renal status; monitoring diabetes, chronic kidney disease, hypertension and liver disease; drugs with renal or hepatic toxicity or electrolyte effects; symptoms of fatigue, weakness, edema, jaundice, confusion, nausea and vomiting; acute illness with dehydration or a suspected acid-base disorder; and assessment of volume status.
Chemistry rarely stands alone. Abnormal liver tests → ultrasound first. A reduced filtration rate or albuminuria → urine studies and renal ultrasound; chronicity needs at least three months, and cystatin C confirms the rate when accuracy matters. Ketoacidosis → add ketones with beta-hydroxybutyrate, a venous blood gas, urinalysis, an electrocardiogram (for the potassium) and a complete blood count. Hyponatremia → add serum osmolality with urine sodium and osmolality.
| Test | What it tells you about fluid and electrolyte balance |
|---|---|
| Serum sodium | The primary indicator of water balance, not salt content. Hyponatremia usually means water excess |
| Serum osmolality | Separates true hypotonic hyponatremia from the pseudo- and hypertonic forms; normal tonicity ~275–285 mOsm/kg |
| Urine sodium and osmolality | Localizes it: <20 suggests hypovolemia; >40 with concentrated urine suggests the syndrome of inappropriate antidiuretic hormone secretion |
| Urea nitrogen : creatinine | Volume status and perfusion — a ratio >20 suggests prerenal hypovolemia |
| Potassium | Links to acid-base and adrenal function |
Three pitfalls. Hyperglycemia lowers the measured sodium by about 1.6–2 mEq/L per 100 mg/dL of glucose above normal — use a corrected sodium, from a calculator. Pseudohyponatremia from severe hyperlipidemia or hyperproteinemia gives a falsely low sodium with a normal osmolality. And the number alone never gives the diagnosis — read sodium alongside volume status.
Also tested
- Electrocardiogram in ketoacidosis. The workup includes an electrocardiogram to look for the cardiac effects of a raised potassium, because both high and low potassium can cause life-threatening arrhythmias.
- Sodium in uncontrolled hyperglycemia. Glucose pulls water into the vascular space, lowering measured sodium by roughly 1.6 to 2 mEq/L for every 100 mg/dL above normal. The sodium corrects once the glucose is treated, and a high osmolality shows the patient is not water-overloaded.
- Hyperkalemia. The kidney excretes potassium with essentially no reabsorption, so reduced clearance plus drugs that block its excretion is a common route to it. Small serum changes have large effects; peaked T waves show the membrane is affected and urgent treatment is needed.
- Core tests of water and electrolyte balance. The four are serum sodium, serum osmolality, urine sodium and osmolality, and the urea nitrogen to creatinine ratio, which together locate the problem.
- Imaging after abnormal liver tests. Abnormal liver tests lead to imaging that starts with ultrasound, for steatosis and biliary dilation, then computed tomography or magnetic resonance.
- Diabetes insipidus. Dilute urine while the serum sodium is high is the giveaway: the kidney is shedding water it should be keeping because antidiuretic effect is missing or unheard. Normal glucose rules out the osmotic alternative.
5.9 · The vomiting case — why the two cannot be separated
A 25-year-old woman, three days of intractable nausea and vomiting. The panel shows low sodium, low potassium, low chloride, a raised bicarbonate and alkalemia.
Why it persists: volume, potassium and chloride depletion together force the kidney to reabsorb sodium and bicarbonate, which maintains the alkalosis after the vomiting has stopped. What fixes it: replacing sodium, chloride and potassium — saline with potassium chloride. Not bicarbonate, and not an antiemetic alone. Her speaker note calls this “the single best illustration that you cannot separate electrolytes from acid-base.”
6 · Urinalysis
Instructional Objectives
Topic Outline 6: Urinalysis
- Describe the following urinalysis parameters: i. Specific gravity · ii. pH · iii. Protein · iv. Glucose · v. Ketones · vi. Leukocyte esterase · vii. Nitrites · viii. Blood · ix. Bilirubin
- Differentiate between: i. Hematuria · ii. Hemoglobinuria · iii. Myoglobinuria
- Correlate urinalysis findings with common clinical presentations.
What she said about numbers, on 1 September. “For testing purposes, I would like you to know what a normal urinalysis involves … It’s important to know that we should not find nitrites. We should not find ketones. We should not find glucose. So I do want you to know that. I’m not asking that you memorize ranges, okay? But I do want you to know if there should just be none present at all. But for testing purposes, if there’s a range involved, it’ll be provided for you.”
So the split is clean. Which pads read negative in a healthy person is fair to know cold. A reference range is not — it will be given to you. Learn the direction of abnormality and what it means.
One naming point she asked for twice: “Please make sure you call it nitrites and not nitrates. It’s like a pet peeve of mine.” Nitrates are what is in the urine to begin with; bacteria reduce them to nitrites, and the nitrite is what the pad reports.
6.1 · What the test is, and when to order it
Urinalysis examines the physical, chemical and microscopic contents of urine. It is inexpensive, non-invasive and fast, which is why it is done routinely on admission and in primary care, obstetrics and pediatrics alike. In a renal evaluation it complements the serum creatinine and blood urea nitrogen rather than replacing them.
It reaches well beyond the urinary tract: it speaks to hepatic and biliary disease, hydration status and infection. Any patient with abdominal, pelvic or back pain needs one.
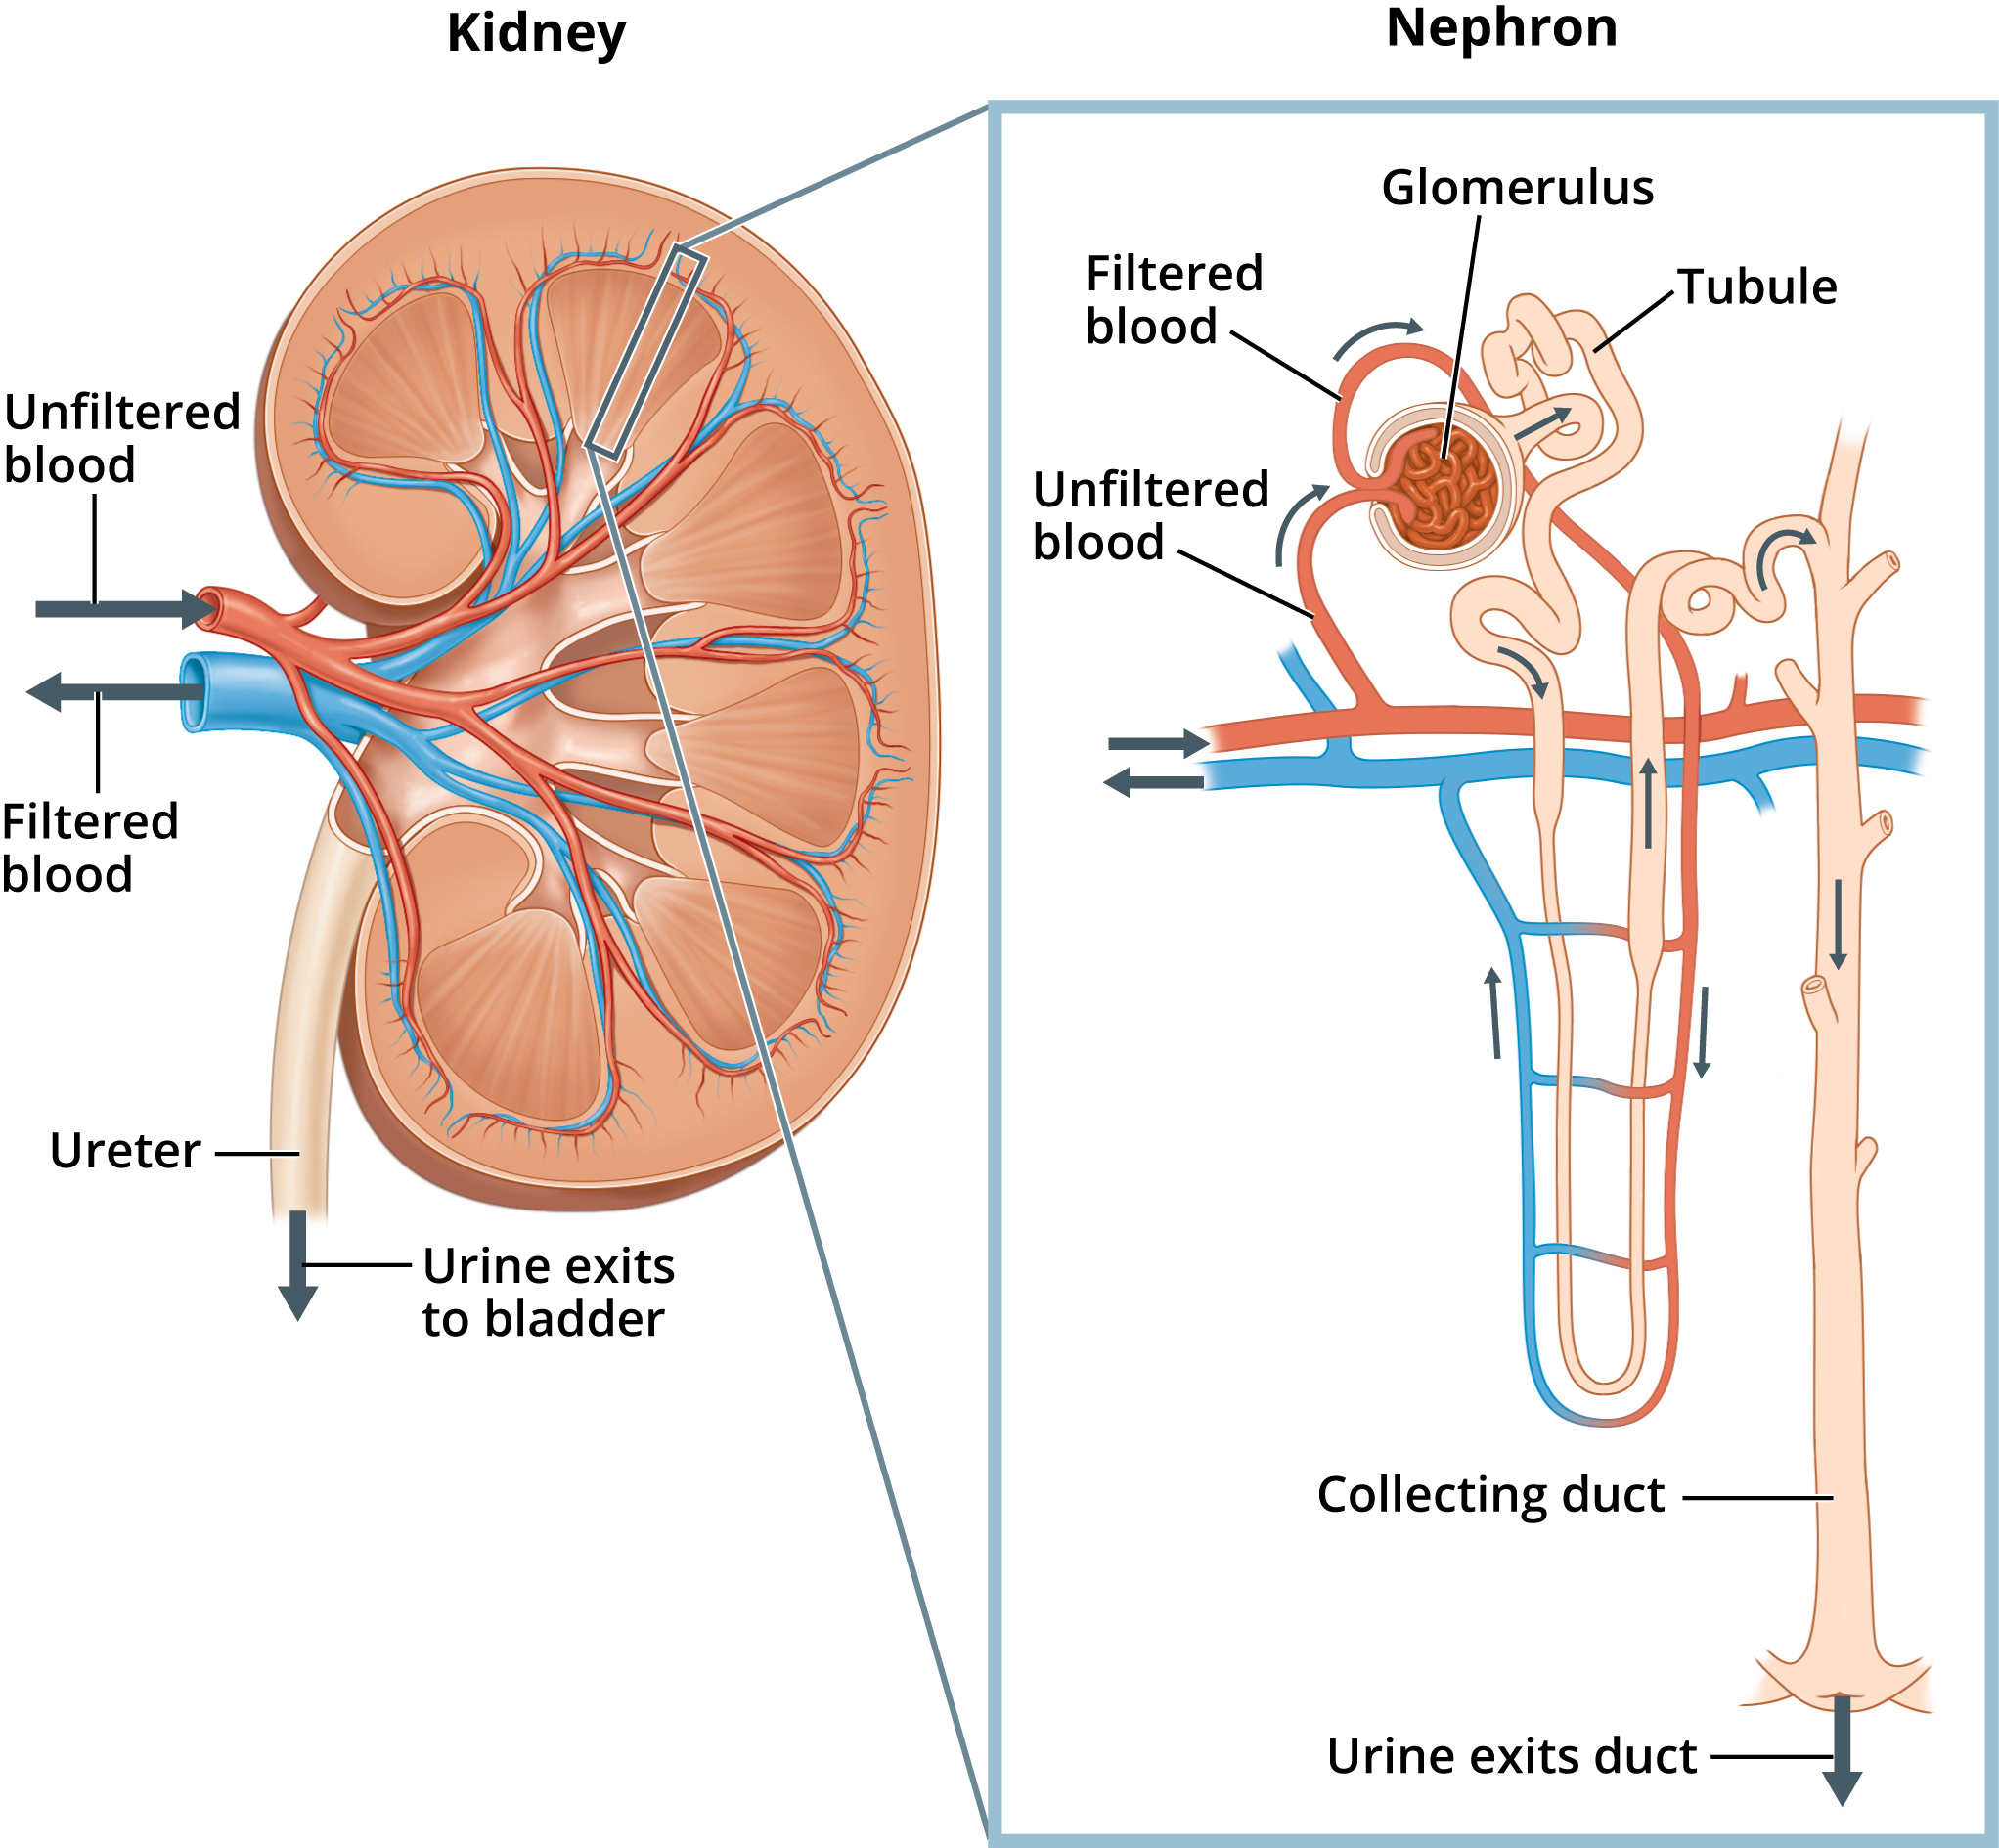
6.2 · Inspection — color, transparency, odor
The examination starts the way a physical examination does, by looking.
| Color | Suggests |
|---|---|
| Pale yellow to colorless | Dilute urine — possibly overhydrated |
| Dark yellow or amber | Concentrated urine — possibly dehydrated |
| Yellow-brown or green | Bilirubin — hepatitis, cirrhosis, biliary obstruction |
| Bright or dark red | Blood — infection, stone, tumor, or menstrual contamination |
| Blue, orange or green | Medications — phenazopyridine, rifampicin, urinary anesthetics |
The medication colors are a patient education point: tell the patient before they start, so a startling color does not alarm them.
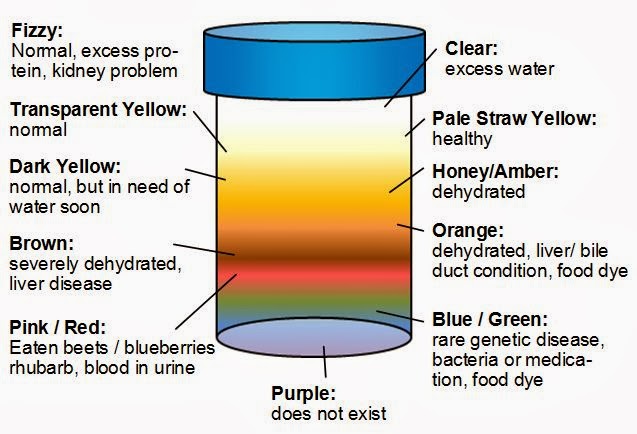
Transparency runs clear → hazy → cloudy → turbid. Cloudiness comes from red cells, white cells, epithelial cells, bacteria, yeast, crystals, mucus, contrast media or fat. Foam is the one to notice separately — it points to protein.
Odor. Normal is called aromatic. An ammonia smell means the sample has stood long enough for bacteria to decompose its urea — refrigerate a specimen that will not be read within one to two hours, and add no preservative. A foul odor suggests bacterial infection; a fecal odor suggests an enterovesical fistula; a fruity or sweet odor means ketones, and sends you to the blood sugar.
Also tested
- Fecal-smelling urine. It should raise consideration of a fistula between bowel and bladder (enterovesical fistula), which lets bowel contents reach the bladder.
- Foamy urine. Foam is associated with protein in the urine, so it suggests proteinuria.
- Ammonia smell in a standing specimen. A specimen that smells strongly of ammonia after standing reflects bacteria breaking down the urea as it stood.
6.3 · The reagent strip
A fresh specimen in a sterile container. Strips are kept desiccated. Results come in two shapes: qualitative (positive or negative) and semi-quantitative (trace, 1+, 2+, 3+ — a graded estimate, not a measurement).
Two practical traps. Reading time differs by analyte, so the strip cannot be read all at once. And manufacturers order the pads differently, so a strip must be read against its own chart — reading a pad against the wrong row is how the result goes wrong. An automated reader improves accuracy where one is available.
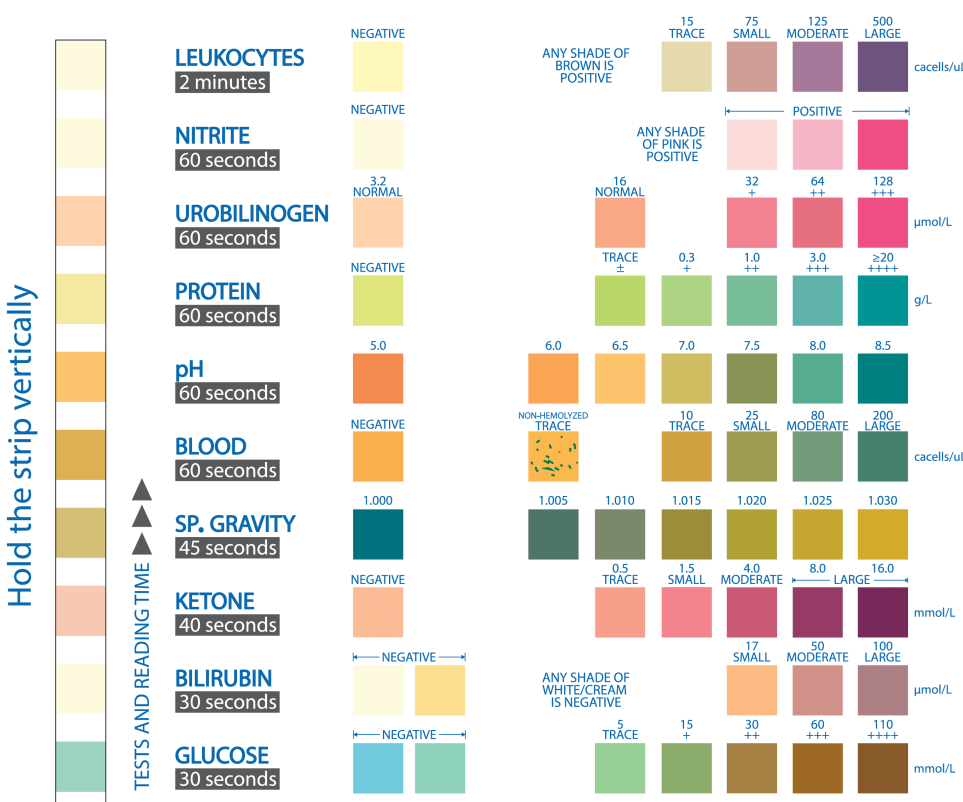
The six that should read negative. Leukocyte esterase, nitrites, ketones, glucose, blood and bilirubin. Protein is negative or trace. Specific gravity and pH are the two that always carry a value — neither is ever simply “negative”. That distinction is worth holding, because it is exactly what she said to know cold.
Also tested
- Nephron. A nephron is made up of two structures, a glomerulus and a tubule.
- Normal urinalysis. Six pads should read negative (leukocyte esterase, nitrites, ketones, glucose, blood and bilirubin) with protein negative or trace, and specific gravity and pH, which always carry a value, in range.
6.4 · pH, and what it does for stones
Urine pH reports the renal tubules' ability to hold the hydrogen ion concentration steady. The kidneys do that by excreting hydrogen ions as ammonium and by reabsorbing and producing bicarbonate. Four things move it: diet, medications, systemic acid-base disorders and tubular function.
| Acidic urine | Alkaline urine | |
|---|---|---|
| Causes | Ketoacidosis, Escherichia coli infection, metabolic and respiratory acidosis, a diet high in meat or cranberries | Urea-splitting organisms (Proteus, Staphylococcus, Klebsiella, Pseudomonas), bacterial contamination, acute and chronic renal failure, renal tubular acidosis, metabolic and respiratory alkalosis, a diet high in fruit and vegetables |
| Stones | Calcium oxalate and uric acid | Triple phosphate and struvite |
| Treatment aim | Alkalinize the urine — chiefly for uric acid stones | Treat the infection, since urease-producing bacteria are driving them |
Note the trap in the left column: renal tubular acidosis produces ALKALINE urine despite its name, because the defect is a failure to excrete acid.
Also tested
- Uric acid stones. Management aims to make the urine more alkaline; alkalinizing the urine is the treatment.
- Urine formation. Whatever fluid and waste the tubules do not reabsorb is excreted as urine.
- Kidneys and pH balance. The kidneys mainly maintain pH by excreting hydrogen ions and keeping bicarbonate: acid out, bicarbonate kept and made.
6.5 · The two infection pads
Leukocyte esterase detects the esterase that white cells release. “Leukocyte esterase indicates pyuria. That’s the take-home point.” It rises with urinary tract infection, and also with interstitial cystitis and glomerulonephritis, both inflammatory rather than infective.
Nitrites. Urease-producing bacteria carry a reductase that turns urinary nitrates into nitrites. Two conditions have to be met for the pad to work: a urease-producing organism, and more than four hours of urine sitting in the bladder for the conversion. Sensitivity is about 50%, lower than leukocyte esterase.
The single most emphasized idea in the lecture. “Remember which one did I say was most common? E. coli. E. coli is not urease-positive. If nitrites is positive, it’s very helpful … but if nitrites is negative, it does not rule out a urinary tract infection, because the majority of simple urinary tract infections are caused by E. coli, which will not cause this to turn positive.”
So: a positive nitrite is useful; a negative one is not. Either way, if the patient is symptomatic, send a culture and sensitivity. The same holds for a negative leukocyte esterase. In young children the pad is less reliable still, because they void too often for the conversion to happen.
Also tested
- Negative urine nitrite. It does not exclude infection, because nitrite sensitivity is only about 50% and the commonest organism is rarely a nitrite producer. With symptoms and a positive leukocyte esterase, still send culture and sensitivity.
- Why a negative nitrite does not exclude infection. Escherichia coli, the commonest organism, is rarely urease-positive and so does not turn the pad positive.
- Urinary nitrites. Nitrites appear when bacteria reduce urinary nitrates to nitrites; bacterial reductase performs the conversion.
6.6 · Ketones and glucose
Ketones are made in the liver from fatty acids and normally metabolized completely, so almost none reaches the urine. Ketonuria means cells are burning fatty acids rather than glucose — uncontrolled diabetes and ketoacidosis, starvation, fasting, alcoholic ketoacidosis, a high-fat low-carbohydrate diet, liver disease, and febrile illness in infants and children. Ketones on a strip should send you to the glucose.
Glucose is filtered freely and then wholly reabsorbed in the proximal tubules, so none should appear. It spills once the blood level exceeds the tubular threshold — around 180 milligrams per deciliter. Glucosuria is not diagnostic, because the threshold differs between people, but it always means further workup.
Three ways glucose appears without uncontrolled diabetes: impaired tubular reabsorption, so it spills at a normal blood level; dextrose-containing intravenous fluids; and pregnancy, where a trace is normal because the threshold falls.
Also tested
- Glucose in urine with dextrose. Glucosuria is expected, a recognized and normal explanation, in a patient receiving intravenous fluids containing dextrose.
- Sweet-smelling urine with ketones and glucose. This fits uncontrolled diabetes mellitus, with glucose spilling alongside ketones from fatty acid metabolism.
- Ketonuria. It indicates cells are metabolizing fatty acids instead of glucose; ketones are the by-product of that switch.
- Glucosuria with normal serum glucose. Renal disease that impairs tubular reabsorption can produce glucosuria even when the serum glucose is within normal limits; the leak is tubular rather than a high blood level.
6.7 · Objective b — blood, and the three things it can mean
This is the objective that carries its own bullet in the syllabus, and it turns on one fact: the pad detects heme, and heme sits in red cells, in free hemoglobin and in myoglobin alike. A positive result does not say which. What separates them is what else is true.
| Hematuria | Hemoglobinuria | Myoglobinuria | |
|---|---|---|---|
| What is in the urine | Intact red cells | Free hemoglobin, no intact cells | Myoglobin, no intact cells |
| Where it comes from | Bleeding anywhere along the urinary tract | Intravascular destruction of red cells | Skeletal muscle injury |
| Causes | Infection, inflammation, trauma, tumor, calculus, over-aggressive anticoagulation | Hemolysis, hemolytic anemia (sickle cell), transfusion reaction, severe burns | Trauma, electric shock, rhabdomyolysis from compression injury, hyperthermia or statins |
| The confirming serum test | — (red cells seen on microscopy) | Raised unconjugated bilirubin | Raised creatine phosphokinase |
Gross hematuria is visible to the naked eye; microscopic hematuria needs analysis to find, and is defined as three or more red cells. A trace of blood can follow strenuous exercise in an otherwise well patient.
Also tested
- Myoglobinuria. The myoglobin comes from damaged skeletal muscle; muscle injury releases it.
- Positive urine blood pad. The pad cannot tell which source is responsible, because it does not differentiate between them.
- Hemoglobinuria from intravascular hemolysis. A positive blood pad with no red cells, a normal muscle enzyme, and high unconjugated bilirubin, a direct product of hemoglobin breakdown, indicate it; the bilirubin is the confirming test for this pigment.
- Positive blood pad without red cells. With no red cells on microscopy and a raised serum creatine phosphokinase, the cause is myoglobinuria, because a raised creatine phosphokinase points to muscle.
- Hemolytic anemia. A high reticulocyte count with a raised unconjugated bilirubin and an undetectable haptoglobin is the hemolysis triad: cells are being destroyed, free hemoglobin mops up the haptoglobin, and the marrow compensates hard.
- Blood pad on a reagent strip. The blood pad detects heme, which is present in all three of the possible sources of blood.
6.8 · Bilirubin and protein
Bilirubin. Only the conjugated form appears, because only it is water soluble. So bilirubinuria points to disease after conjugation — hepatic disease, or biliary obstruction such as a gallstone. Its screening value is timing: it can appear days before the patient looks jaundiced.
Protein — albumin, mostly — reports on glomerular and tubular function, and is reported semi-quantitatively. A trace can be normal in pregnancy, fever and strenuous exercise. Contamination with prostatic or vaginal secretions gives a false positive. Persistent proteinuria is a significant sign of renal disease, and a positive strip is followed by a twenty-four hour collection, which measures it properly rather than estimating.
| Mechanism | Causes |
|---|---|
| Diminished tubular reabsorption | Renal tubular disease, pyelonephritis, interstitial nephritis |
| Transient, mild | After exercise, acute illness, bleeding or infection in the urinary tract |
| Glomerular damage | Nephrotic syndrome (massive proteinuria), glomerulonephritis, diabetes mellitus, polycystic kidney disease, systemic lupus erythematosus, preeclampsia |
| Increased serum protein | Multiple myeloma — overflow of Bence Jones proteins |
The dipstick cannot find myeloma. “[Reagent strips] do not react to the Bence Jones proteins that are associated with multiple myeloma … we actually use urine protein electrophoresis to diagnose it, not a dipstick.” A negative protein pad does not exclude light chains. This one is on the slide as a footnote and stated plainly in the recording.
Protein in the urine is not pathognomonic for anything — her words. It narrows the field; it does not name the disease.
Also tested
- Bilirubinuria. It is valuable as a screening finding because it can precede visible jaundice by days.
- Negative dipstick protein. Reagent strips detect albumin and are insensitive to the light chains of a paraprotein, so they miss Bence Jones protein; with a raised total protein and rouleaux, send urine protein electrophoresis.
- Heavy dipstick proteinuria. The strip is semi-quantitative (trace, 1+, 2+ are graded estimates), so heavy proteinuria with low albumin and edema needs a twenty-four hour urine collection to quantify the protein.
- False positive protein pad. Contamination by genital secretions is the recognized cause.
- Negative dipstick protein with bone pain, anemia and raised total protein. Send urine protein electrophoresis; a negative pad does not exclude light chains.
6.9 · Specific gravity
The weight of the solutes in urine against an equal volume of water, which estimates the kidneys' concentrating and excretory ability. Water is 1.000, and urine can never quite reach it, because there is always some solute — hence a floor around 1.002.
It is affected by particle size, not just particle number. Her image: marbles dropped into a beaker weigh far more than the same volume of glitter. That is why radiographic contrast, whose particles are large, drives it above 1.040.
| Low — dilute urine | High — concentrated urine |
|---|---|
| Overhydration; diuresis; chronic kidney disease with lost concentrating ability; diabetes insipidus (less antidiuretic hormone, more water out) | Dehydration; reduced renal blood flow (heart failure, hypotension, renal artery stenosis); syndrome of inappropriate antidiuretic hormone (more hormone, less water out); contrast above 1.040 |
Insipidus means tasteless — the historical way of separating the two diabetes was to taste the urine. Sweet was mellitus; tasteless, and dilute, was insipidus.
6.10 · What comes after the strip
A microscopic urinalysis adds white cells, red cells, squamous epithelial cells, casts and crystals, and the specimen can go on for culture and sensitivity to name the organism and the agent that will treat it.
Bacteria are significant when the specimen came by straight catheterization, or when they sit alongside raised white cells and a positive leukocyte esterase. They are probably not significant when there are more than twenty squamous epithelial cells per high power field (contamination), or when they come from a longstanding indwelling catheter, which is colonized rather than acutely infected. Gram stain and culture are what make the diagnosis definitive.
Also tested
- Bacteria with many squamous cells. More than 20 squamous epithelial cells per high power field means skin and genital flora were picked up, so bacteria are probably contamination and the sample should be repeated, especially with negative leukocyte esterase and nitrites.
- Many squamous cells on urine microscopy. More than twenty squamous epithelial cells per high power field means the specimen is likely contaminated and should be treated that way, especially when there are no symptoms.
- Bacteria with a long-term catheter. Bacteria in the urine without symptoms in a patient with a longstanding indwelling catheter most likely represent catheter colonization, since long-term catheters are colonized.
- Dipstick pattern of infection. Positive leukocyte esterase, nitrites and blood, with glucose, bilirubin, ketones and protein all negative, fits a urinary tract infection: pyuria with nitrites and blood and nothing pointing elsewhere.
- Stones with urea-splitting infection. Urease-producing bacteria split urea to ammonia, making alkaline urine in which struvite and triple phosphate stones form; the stone is a consequence of the infection, so the principle is to treat the infection.
- Glomerulonephritis on urinalysis. In glomerulonephritis, blood and protein together, with dysmorphic red cells and red cell casts, localize the bleeding to the glomerulus, since casts form in the tubule and the cells came from above it. Preceding pharyngitis and hypertension complete the picture.
6.11 · The worked case
A 28-year-old woman, two days of dysuria, frequency and urgency, mild suprapubic discomfort. No fever, no flank pain, no vaginal discharge. Temperature 37.0°C, blood pressure 112/68, heart rate 88, respiratory rate 16, oxygen saturation 99% on room air. Mild suprapubic tenderness, no costovertebral angle tenderness.
Next step: urinalysis. The dipstick came back positive for leukocyte esterase, nitrites and blood, and negative for glucose, bilirubin, ketones and protein.
Read it in two halves. The positives give pyuria, urease-producing bacteria and blood — the picture of a urinary tract infection. The negatives matter just as much: no glucose or ketones argues against a metabolic cause, no bilirubin against a hepatic one, and no protein against glomerular disease. Then send the culture and sensitivity.
Slide 36 is an unfinished answer slide — a dipstick chart carrying three unlabelled marks. Which analytes they sit against was resolved from their position on the chart, and matches what she read out. The recording stops mid-sentence at 49:41, part-way through her explanation, so the last few seconds of the class are not on tape.
Also tested
- Dysuria, frequency and urgency with mild suprapubic tenderness. When the patient is afebrile with no flank pain, the next step is urinalysis, which is quick and non-invasive.
- Ketones on a urine dipstick. Ketones mean cells are burning fatty acids instead of glucose, and the next step is always to check the blood glucose; with glucose also in the urine, uncontrolled diabetes is the working diagnosis until that number comes back.